lattice#
- graph_tool.generation.lattice(shape, periodic=False)[source]#
Generate a N-dimensional square lattice.
- Parameters:
- shapelist or
numpy.ndarray List of sizes in each dimension.
- periodicbool (optional, default:
False) If
True, periodic boundary conditions will be used.
- shapelist or
- Returns:
- lattice_graph
Graph The generated graph.
- lattice_graph
See also
triangulation2D or 3D triangulation
random_graphrandom graph generation
References
Examples
>>> g = gt.lattice([10,10])
>>> pos = gt.sfdp_layout(g)
>>> gt.graph_draw(g, pos=pos, output="lattice.pdf")
<...>
>>> g = gt.lattice([10,20], periodic=True)
>>> pos = gt.sfdp_layout(g)
>>> gt.graph_draw(g, pos=pos, output="lattice_periodic.pdf")
<...>
>>> g = gt.lattice([10,10,10])
>>> pos = gt.sfdp_layout(g)
>>> gt.graph_draw(g, pos=pos, output="lattice_3d.pdf")
<...>
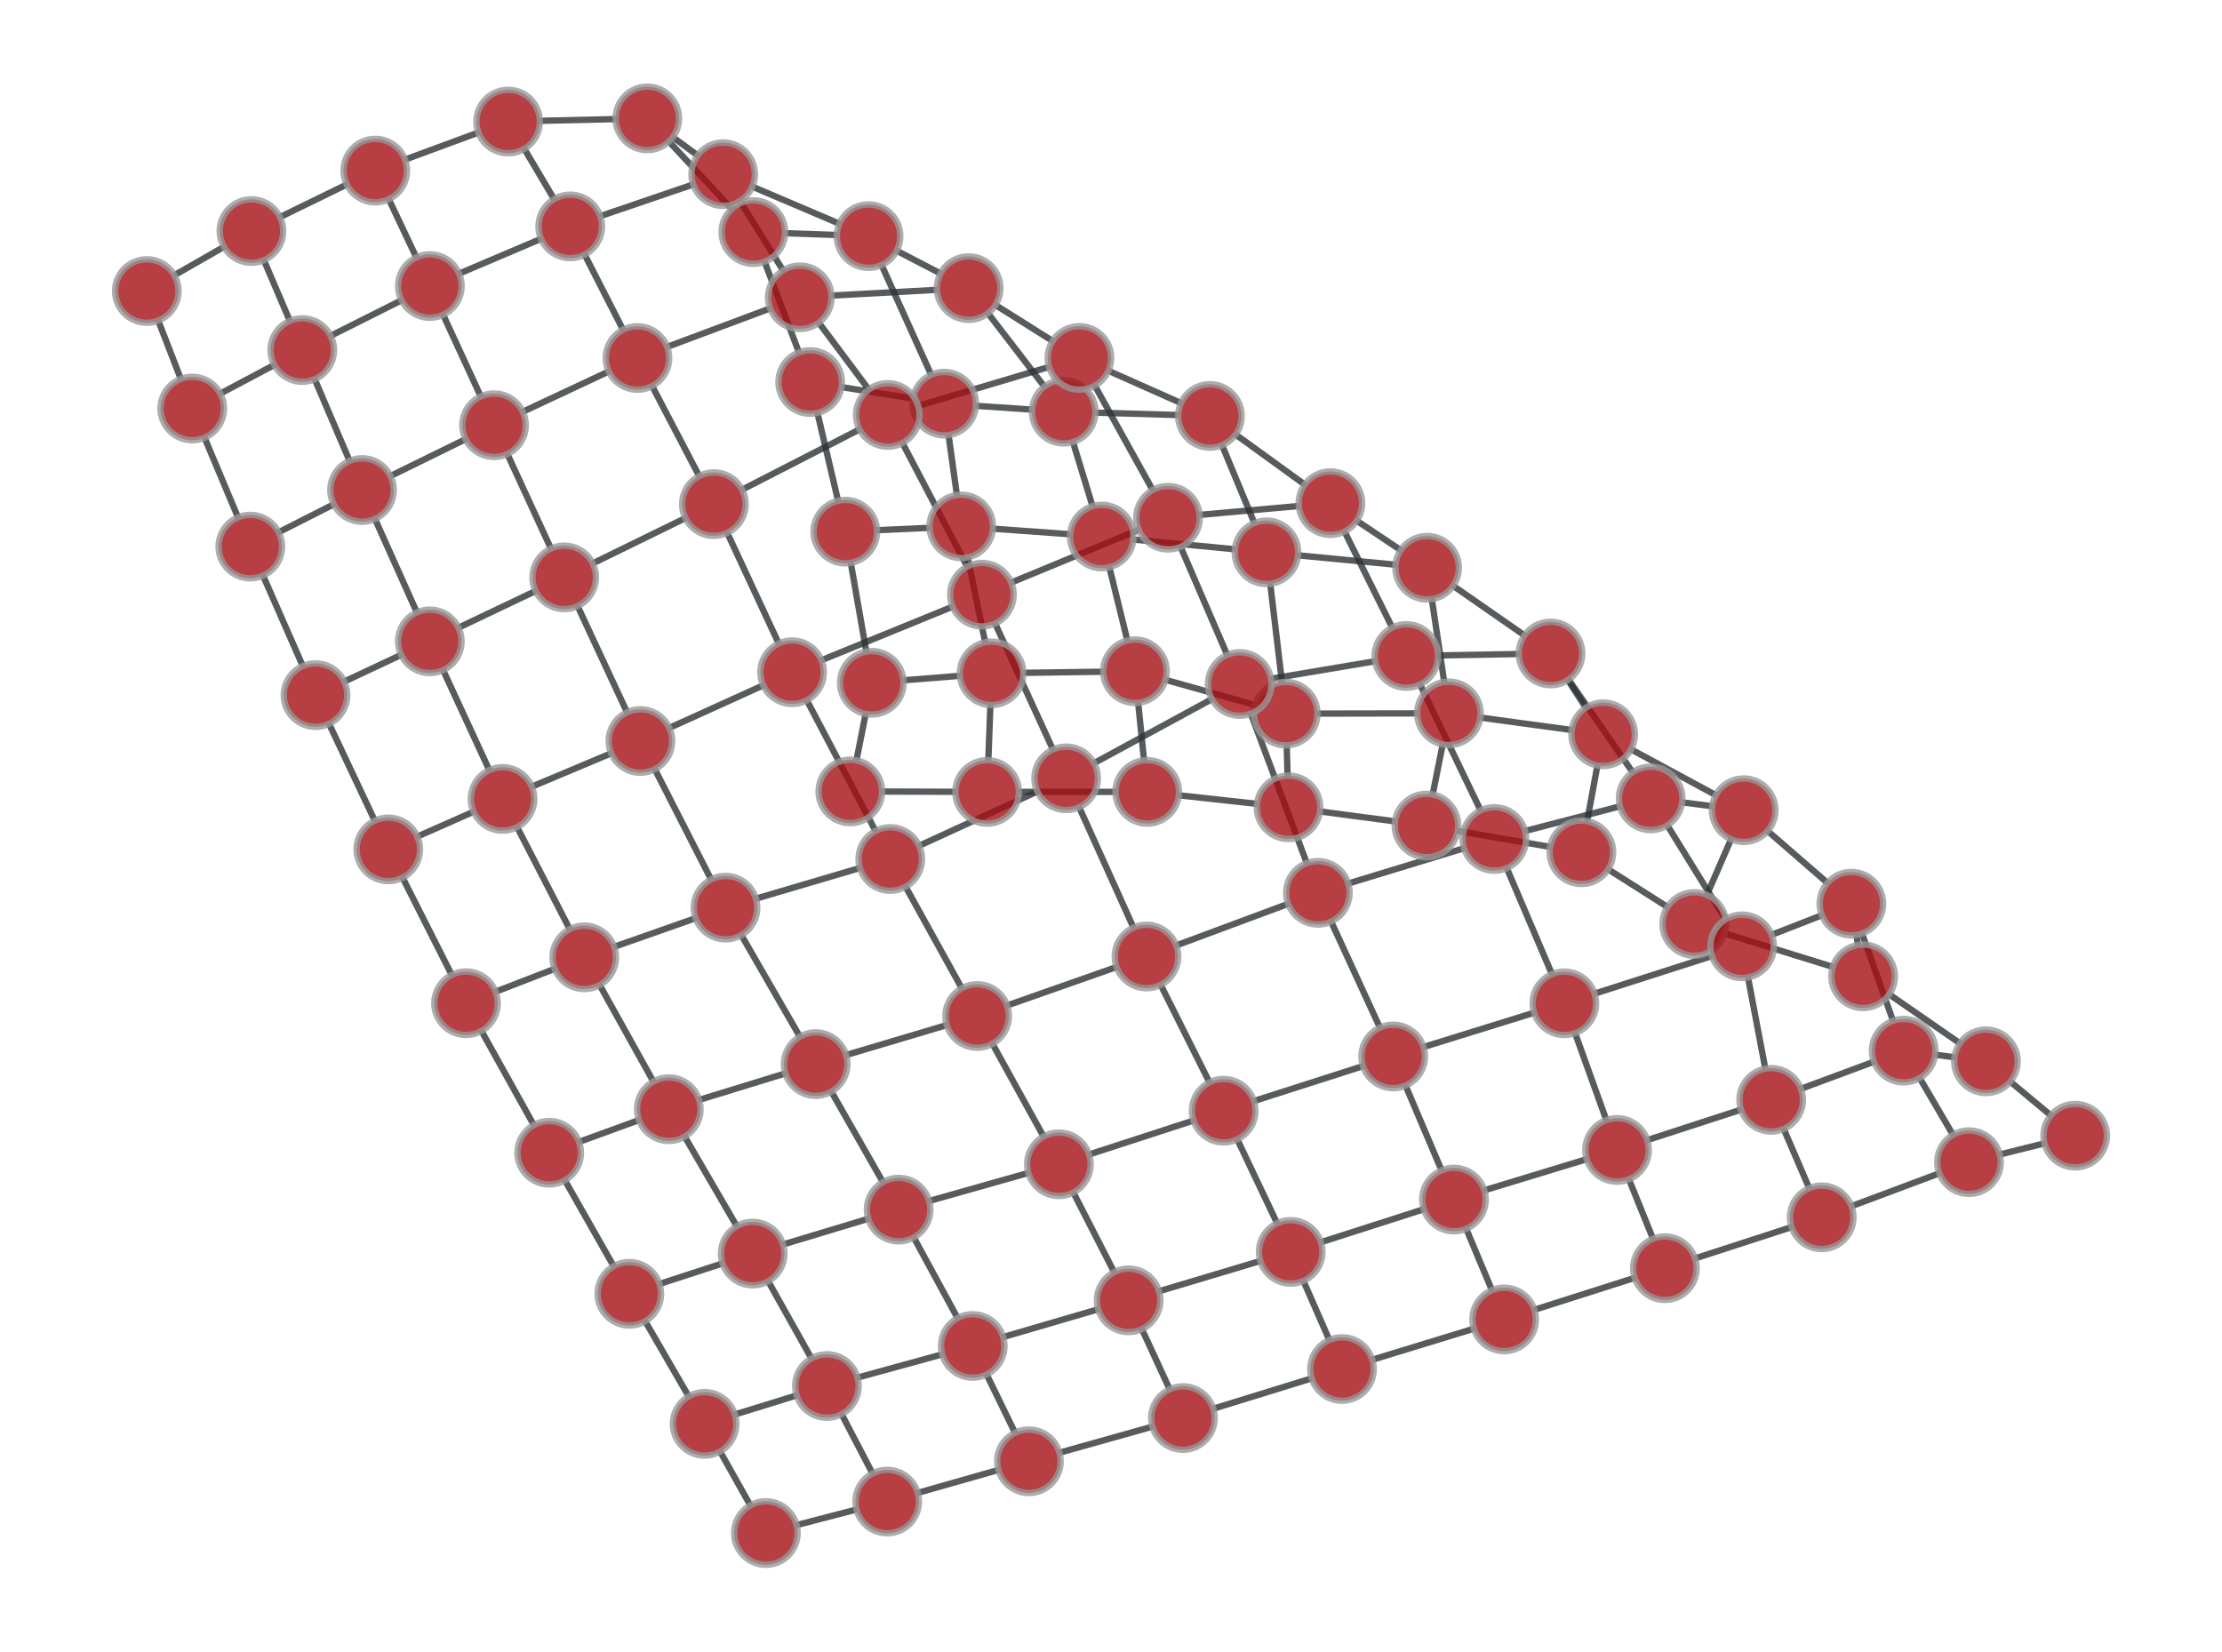
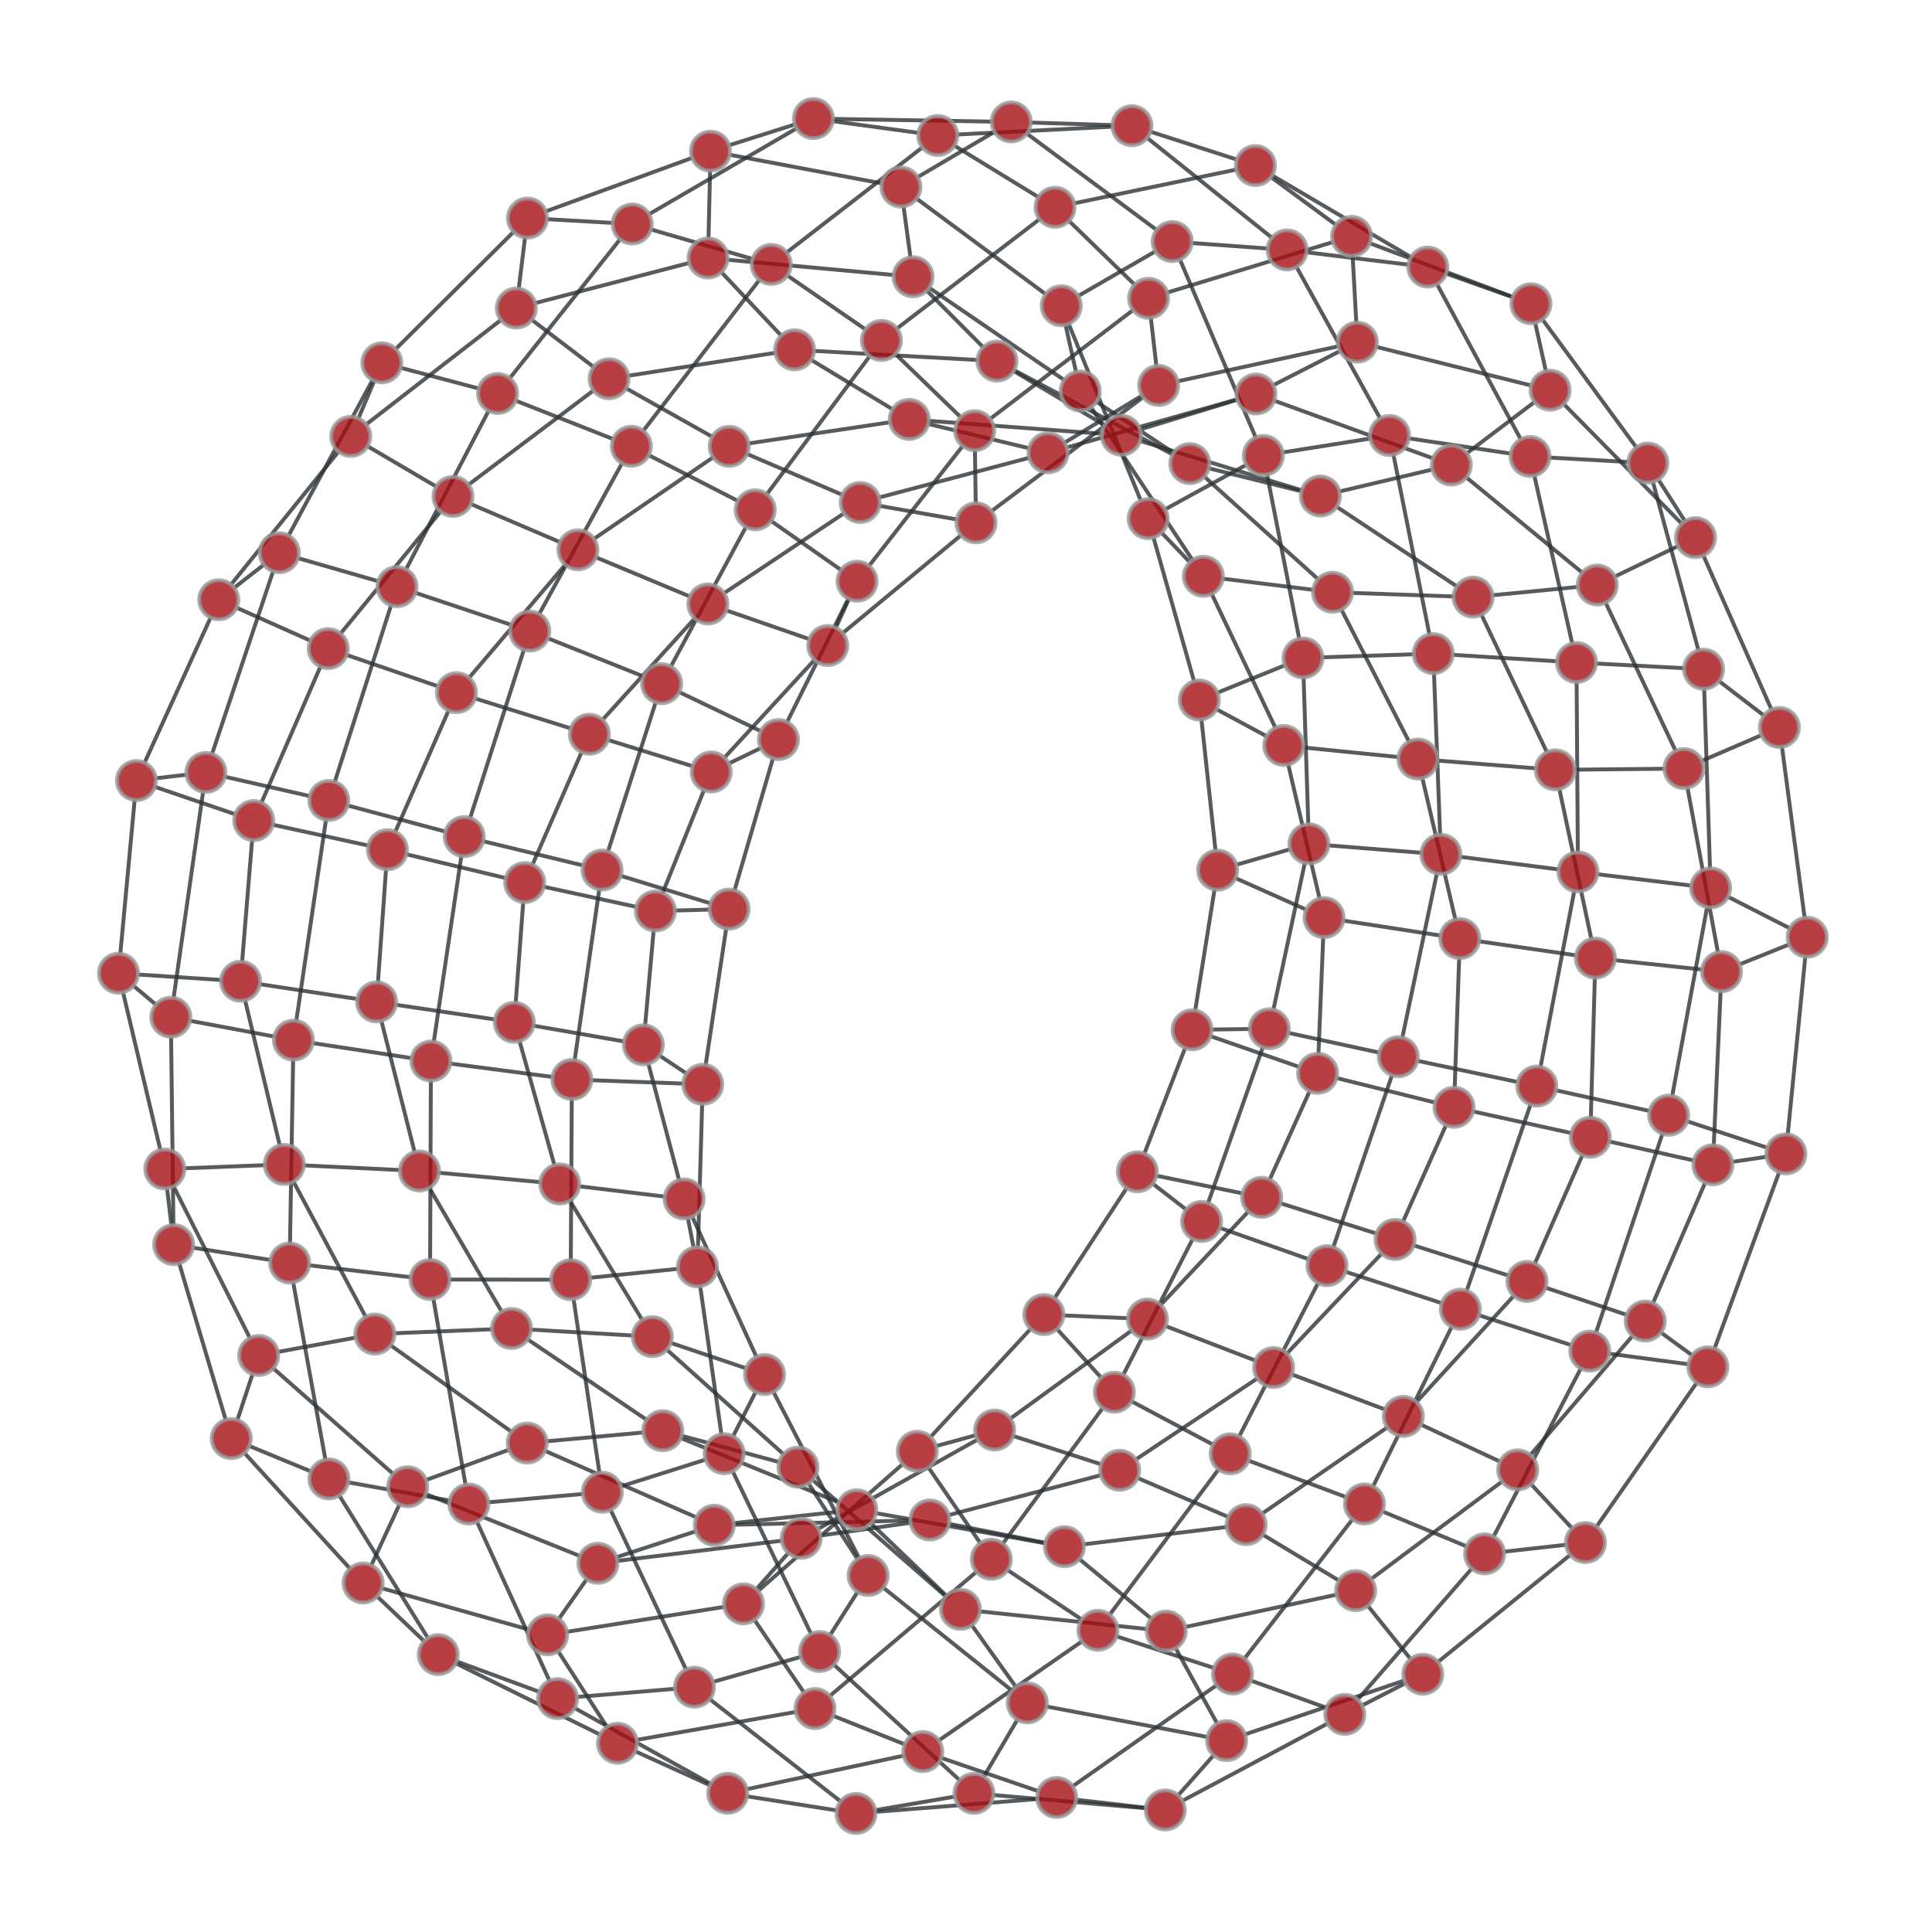
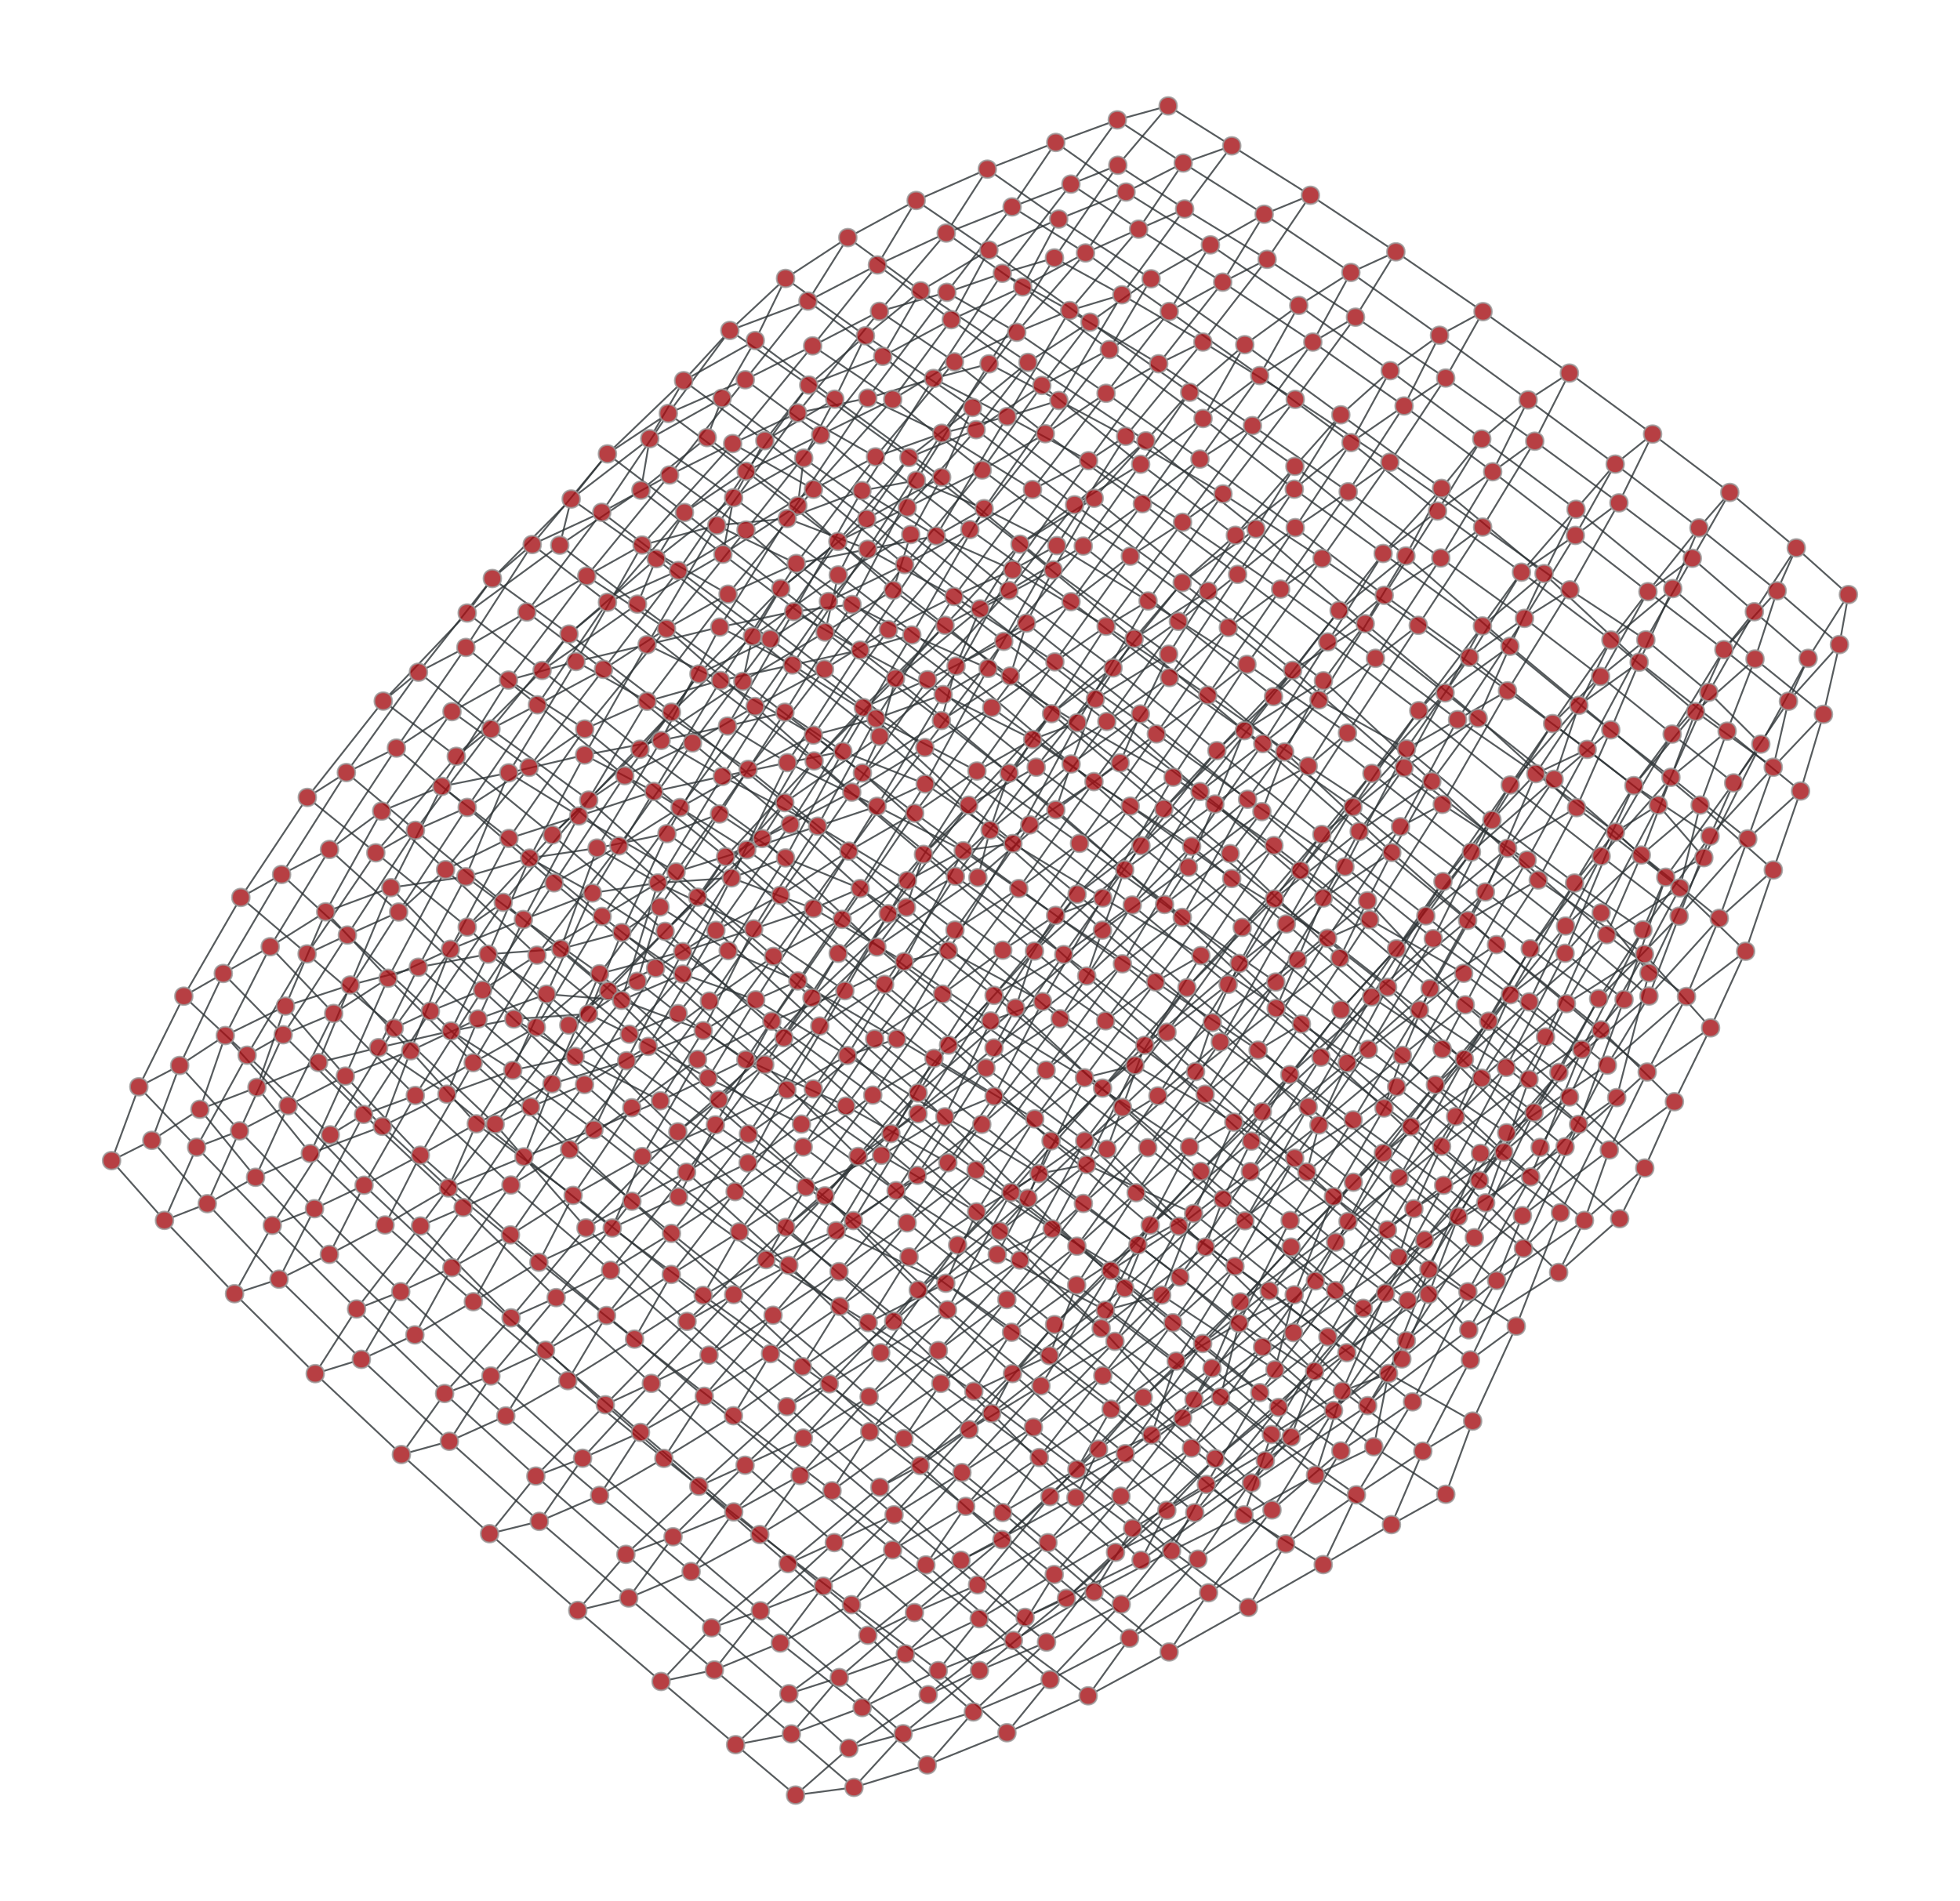
Left: 10x10 2D lattice. Middle: 10x20 2D periodic lattice (torus). Right: 10x10x10 3D lattice.