katz#
- graph_tool.centrality.katz(g, alpha=0.01, beta=None, weight=None, vprop=None, epsilon=1e-06, max_iter=None, norm=True)[source]#
Calculate the Katz centrality of each vertex in the graph.
- Parameters:
- g
Graph Graph to be used.
- weight
EdgePropertyMap(optional, default:None) Edge property map with the edge weights.
- alphafloat, optional (default:
0.01) Free parameter \(\alpha\). This must be smaller than the inverse of the largest eigenvalue of the adjacency matrix.
- beta
VertexPropertyMap, optional (default:None) Vertex property map where the local personalization values. If not provided, the global value of 1 will be used.
- vprop
VertexPropertyMap, optional (default:None) Vertex property map where the values of eigenvector must be stored. If provided, it will be used uninitialized.
- epsilonfloat, optional (default:
1e-6) Convergence condition. The iteration will stop if the total delta of all vertices are below this value.
- max_iterint, optional (default:
None) If supplied, this will limit the total number of iterations.
- normbool, optional (default:
True) Whether or not the centrality values should be normalized.
- g
- Returns:
- centrality
VertexPropertyMap A vertex property map containing the Katz centrality values.
- centrality
See also
betweennessbetweenness centrality
pagerankPageRank centrality
eigenvectoreigenvector centrality
hitsauthority and hub centralities
trust_transitivitypervasive trust transitivity
Notes
The Katz centrality \(\mathbf{x}\) is the solution of the nonhomogeneous linear system
\[\mathbf{x} = \alpha\mathbf{A}\mathbf{x} + \mathbf{\beta},\]where \(\mathbf{A}\) is the (weighted) adjacency matrix and \(\mathbf{\beta}\) is the personalization vector (if not supplied, \(\mathbf{\beta} = \mathbf{1}\) is assumed).
The algorithm uses successive iterations of the equation above, which has a topology-dependent convergence complexity.
Parallel implementation.
If enabled during compilation, this algorithm will run in parallel using OpenMP. See the parallel algorithms section for information about how to control several aspects of parallelization.
References
[katz-centrality][katz-new]L. Katz, “A new status index derived from sociometric analysis”, Psychometrika 18, Number 1, 39-43, 1953, DOI: 10.1007/BF02289026 [sci-hub, @tor]
[adamic-polblogs]L. A. Adamic and N. Glance, “The political blogosphere and the 2004 US Election”, in Proceedings of the WWW-2005 Workshop on the Weblogging Ecosystem (2005). DOI: 10.1145/1134271.1134277 [sci-hub, @tor]
Examples
>>> g = gt.collection.data["polblogs"]
>>> g = gt.GraphView(g, vfilt=gt.label_largest_component(g))
>>> w = g.new_edge_property("double")
>>> w.a = np.random.random(len(w.a))
>>> x = gt.katz(g, weight=w)
>>> gt.graph_draw(g, pos=g.vp["pos"], vertex_fill_color=x,
...               vertex_size=gt.prop_to_size(x, mi=5, ma=15),
...               vcmap=matplotlib.cm.gist_heat,
...               vorder=x, output="polblogs_katz.pdf")
<...>
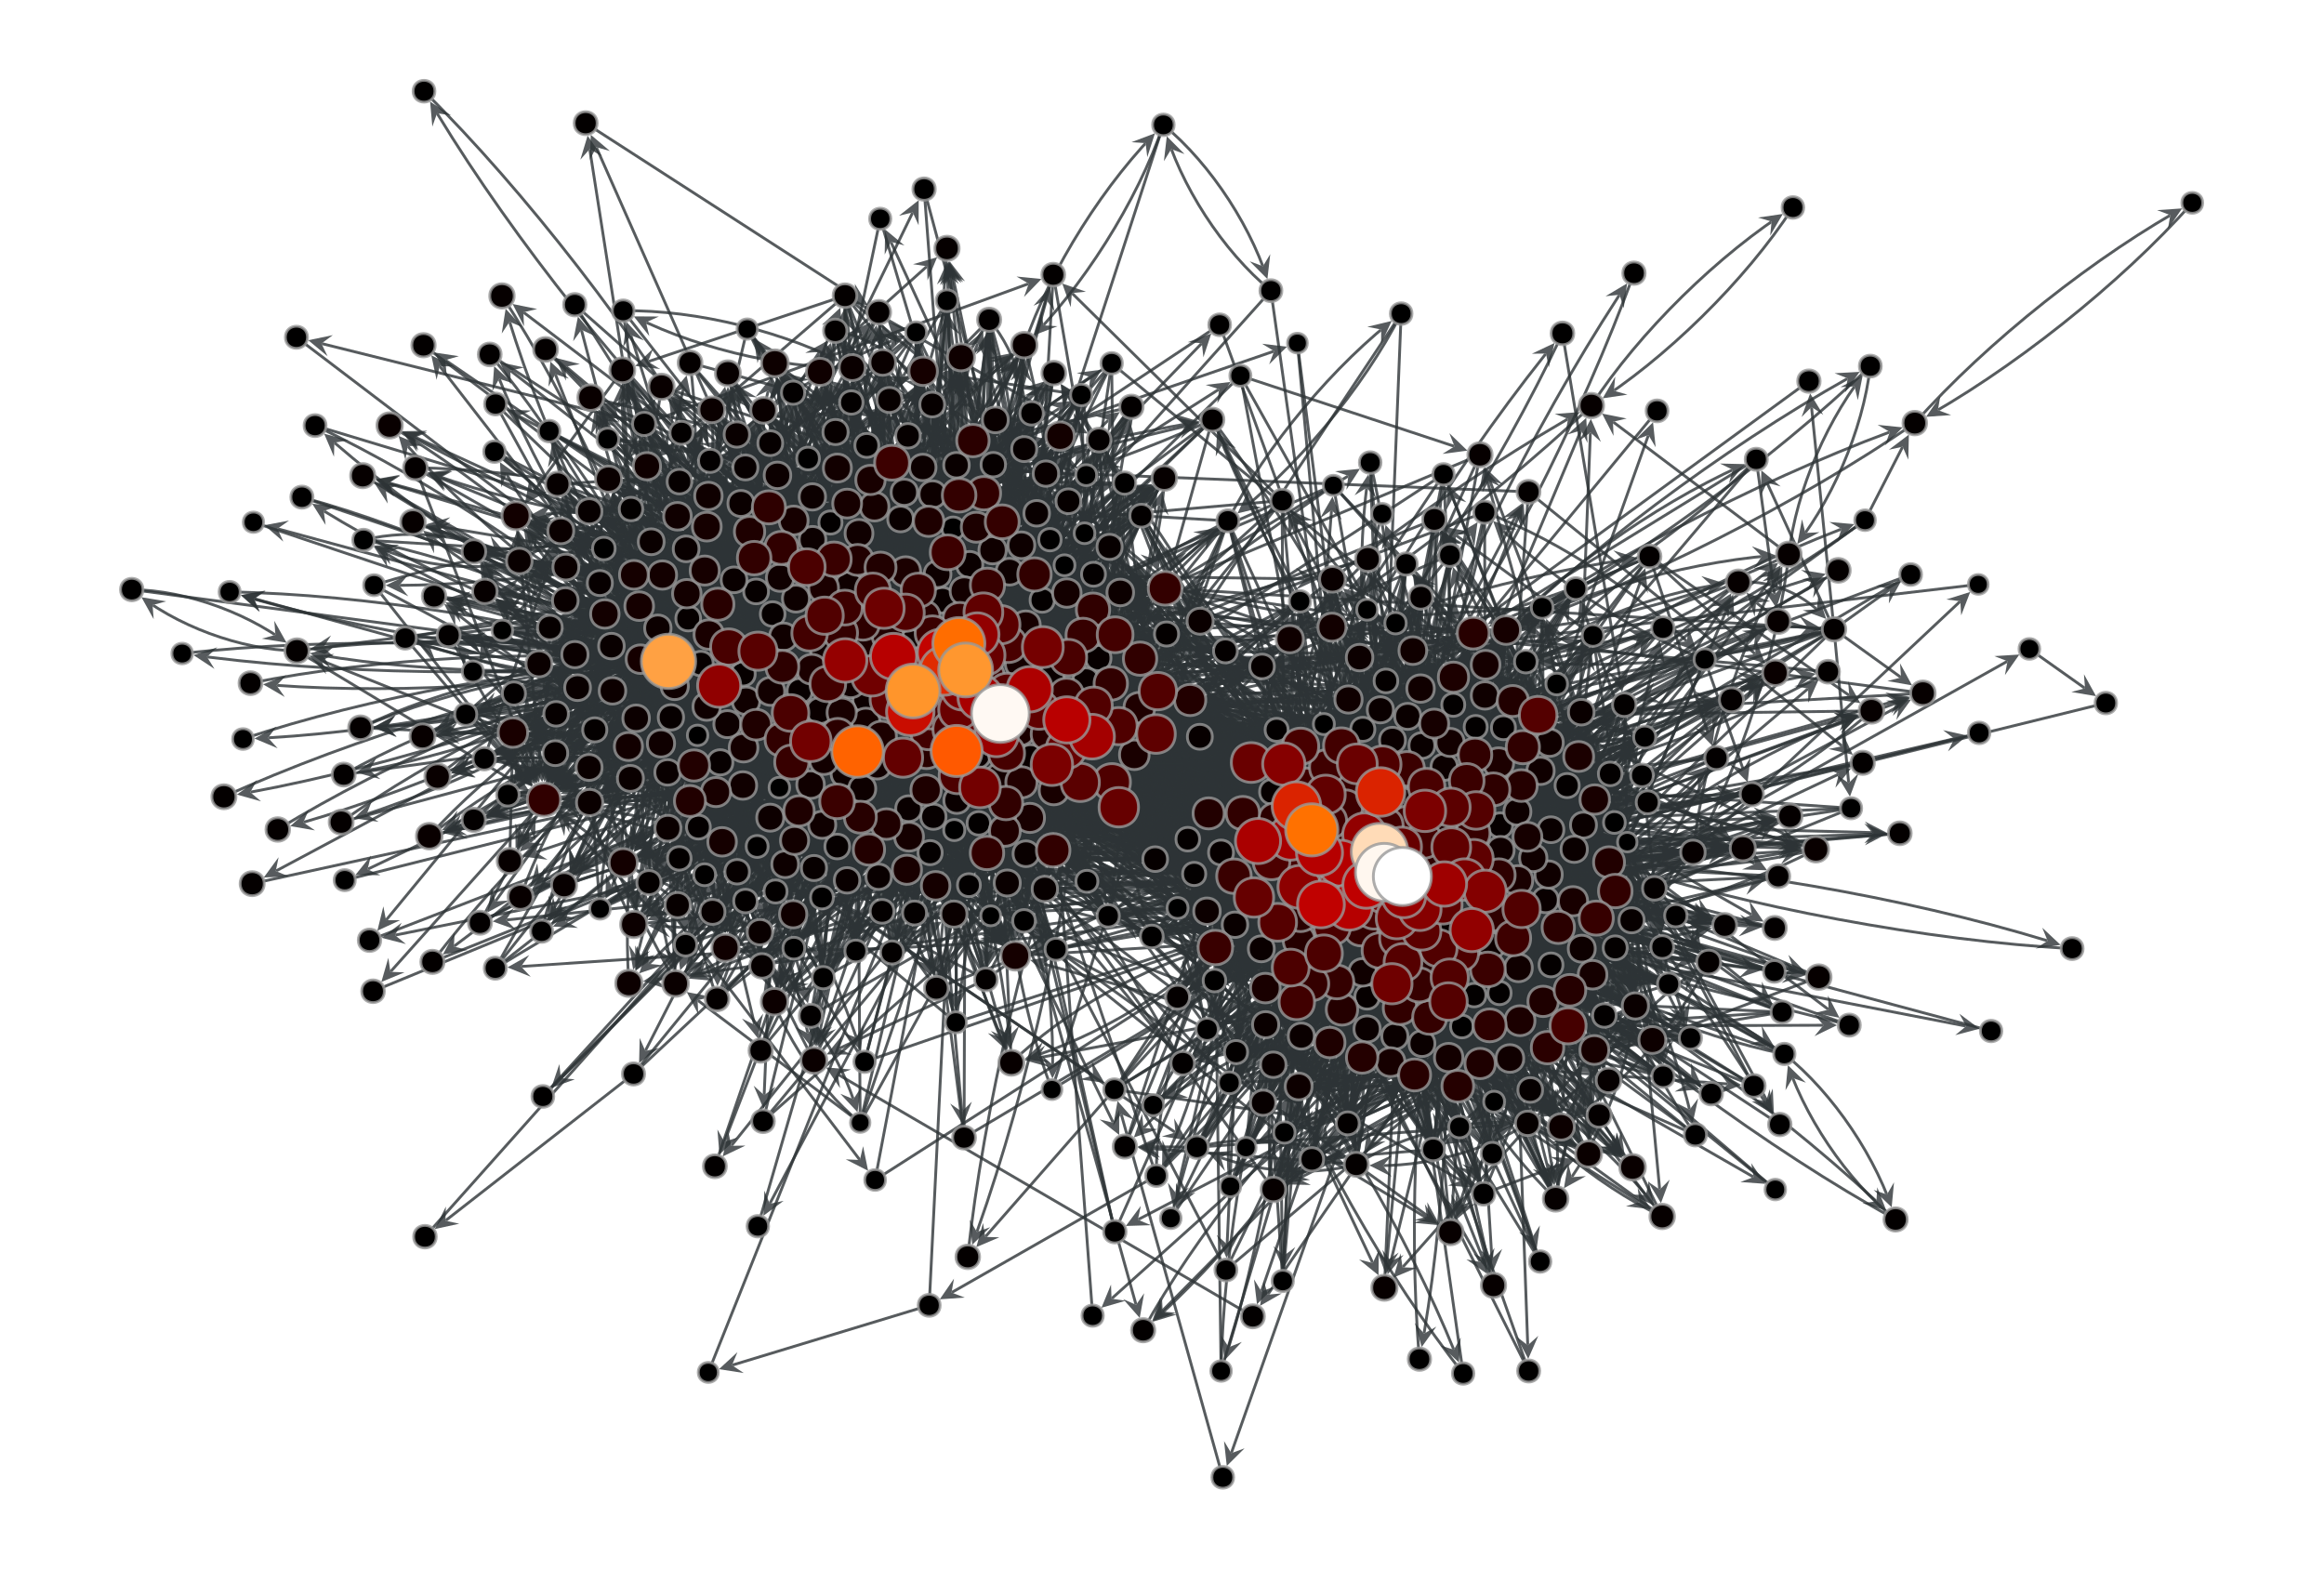
Katz centrality values of the a political blogs network of [adamic-polblogs], with random weights attributed to the edges.#