get_hierarchy_control_points#
- graph_tool.draw.get_hierarchy_control_points(g, t, tpos, beta=0.8, cts=None, is_tree=True, max_depth=None)[source]#
Return the Bézier spline control points for the edges in
g, given the hierarchical structure encoded in graph t.- Parameters:
- g
Graph Graph to be drawn.
- t
Graph Directed graph containing the hierarchy of
g. It must be a directed tree with a single root. The direction of the edges point from the root to the leaves, and the vertices intwith index in the range \([0, N-1]\), with \(N\) being the number of vertices ing, must correspond to the respective vertex ing.- tpos
VertexPropertyMap Vector-valued vertex property map containing the x and y coordinates of the vertices in graph
t.- beta
float(optional, default:0.8orEdgePropertyMap) Edge bundling strength. For
beta == 0the edges are straight lines, and forbeta == 1they strictly follow the hierarchy. This can be optionally an edge property map, which specified a different bundling strength for each edge.- cts
EdgePropertyMap(optional, default:None) Edge property map of type
vector<double>where the control points will be stored.- is_tree
bool(optional, default:True) If
True,tmust be a directed tree, otherwise it can be any connected graph.- max_depth
int(optional, default:None) If supplied, only the first
max_depthbottom levels of the hierarchy will be used.
- g
- Returns:
- cts
EdgePropertyMap Vector-valued edge property map containing the Bézier spline control points for the edges in
g.
- cts
Notes
This is an implementation of the edge-bundling algorithm described in [holten-hierarchical-2006].
References
[holten-hierarchical-2006]Holten, D. “Hierarchical Edge Bundles: Visualization of Adjacency Relations in Hierarchical Data.”, IEEE Transactions on Visualization and Computer Graphics 12, no. 5, 741–748 (2006). DOI: 10.1109/TVCG.2006.147 [sci-hub, @tor]
Examples
>>> g = gt.collection.data["netscience"]
>>> g = gt.GraphView(g, vfilt=gt.label_largest_component(g))
>>> state = gt.minimize_nested_blockmodel_dl(g)
>>> t = gt.get_hierarchy_tree(state)[0]
>>> tpos = pos = gt.radial_tree_layout(t, t.vertex(t.num_vertices() - 1, use_index=False), weighted=True)
>>> cts = gt.get_hierarchy_control_points(g, t, tpos)
>>> pos = g.own_property(tpos)
>>> b = state.levels[0].b
>>> shape = b.copy()
>>> shape.a %= 14
>>> gt.graph_draw(g, pos=pos, vertex_fill_color=b, vertex_shape=shape, edge_control_points=cts,
...               edge_color=[0, 0, 0, 0.3], vertex_anchor=0, output="netscience_nested_mdl.pdf")
<...>
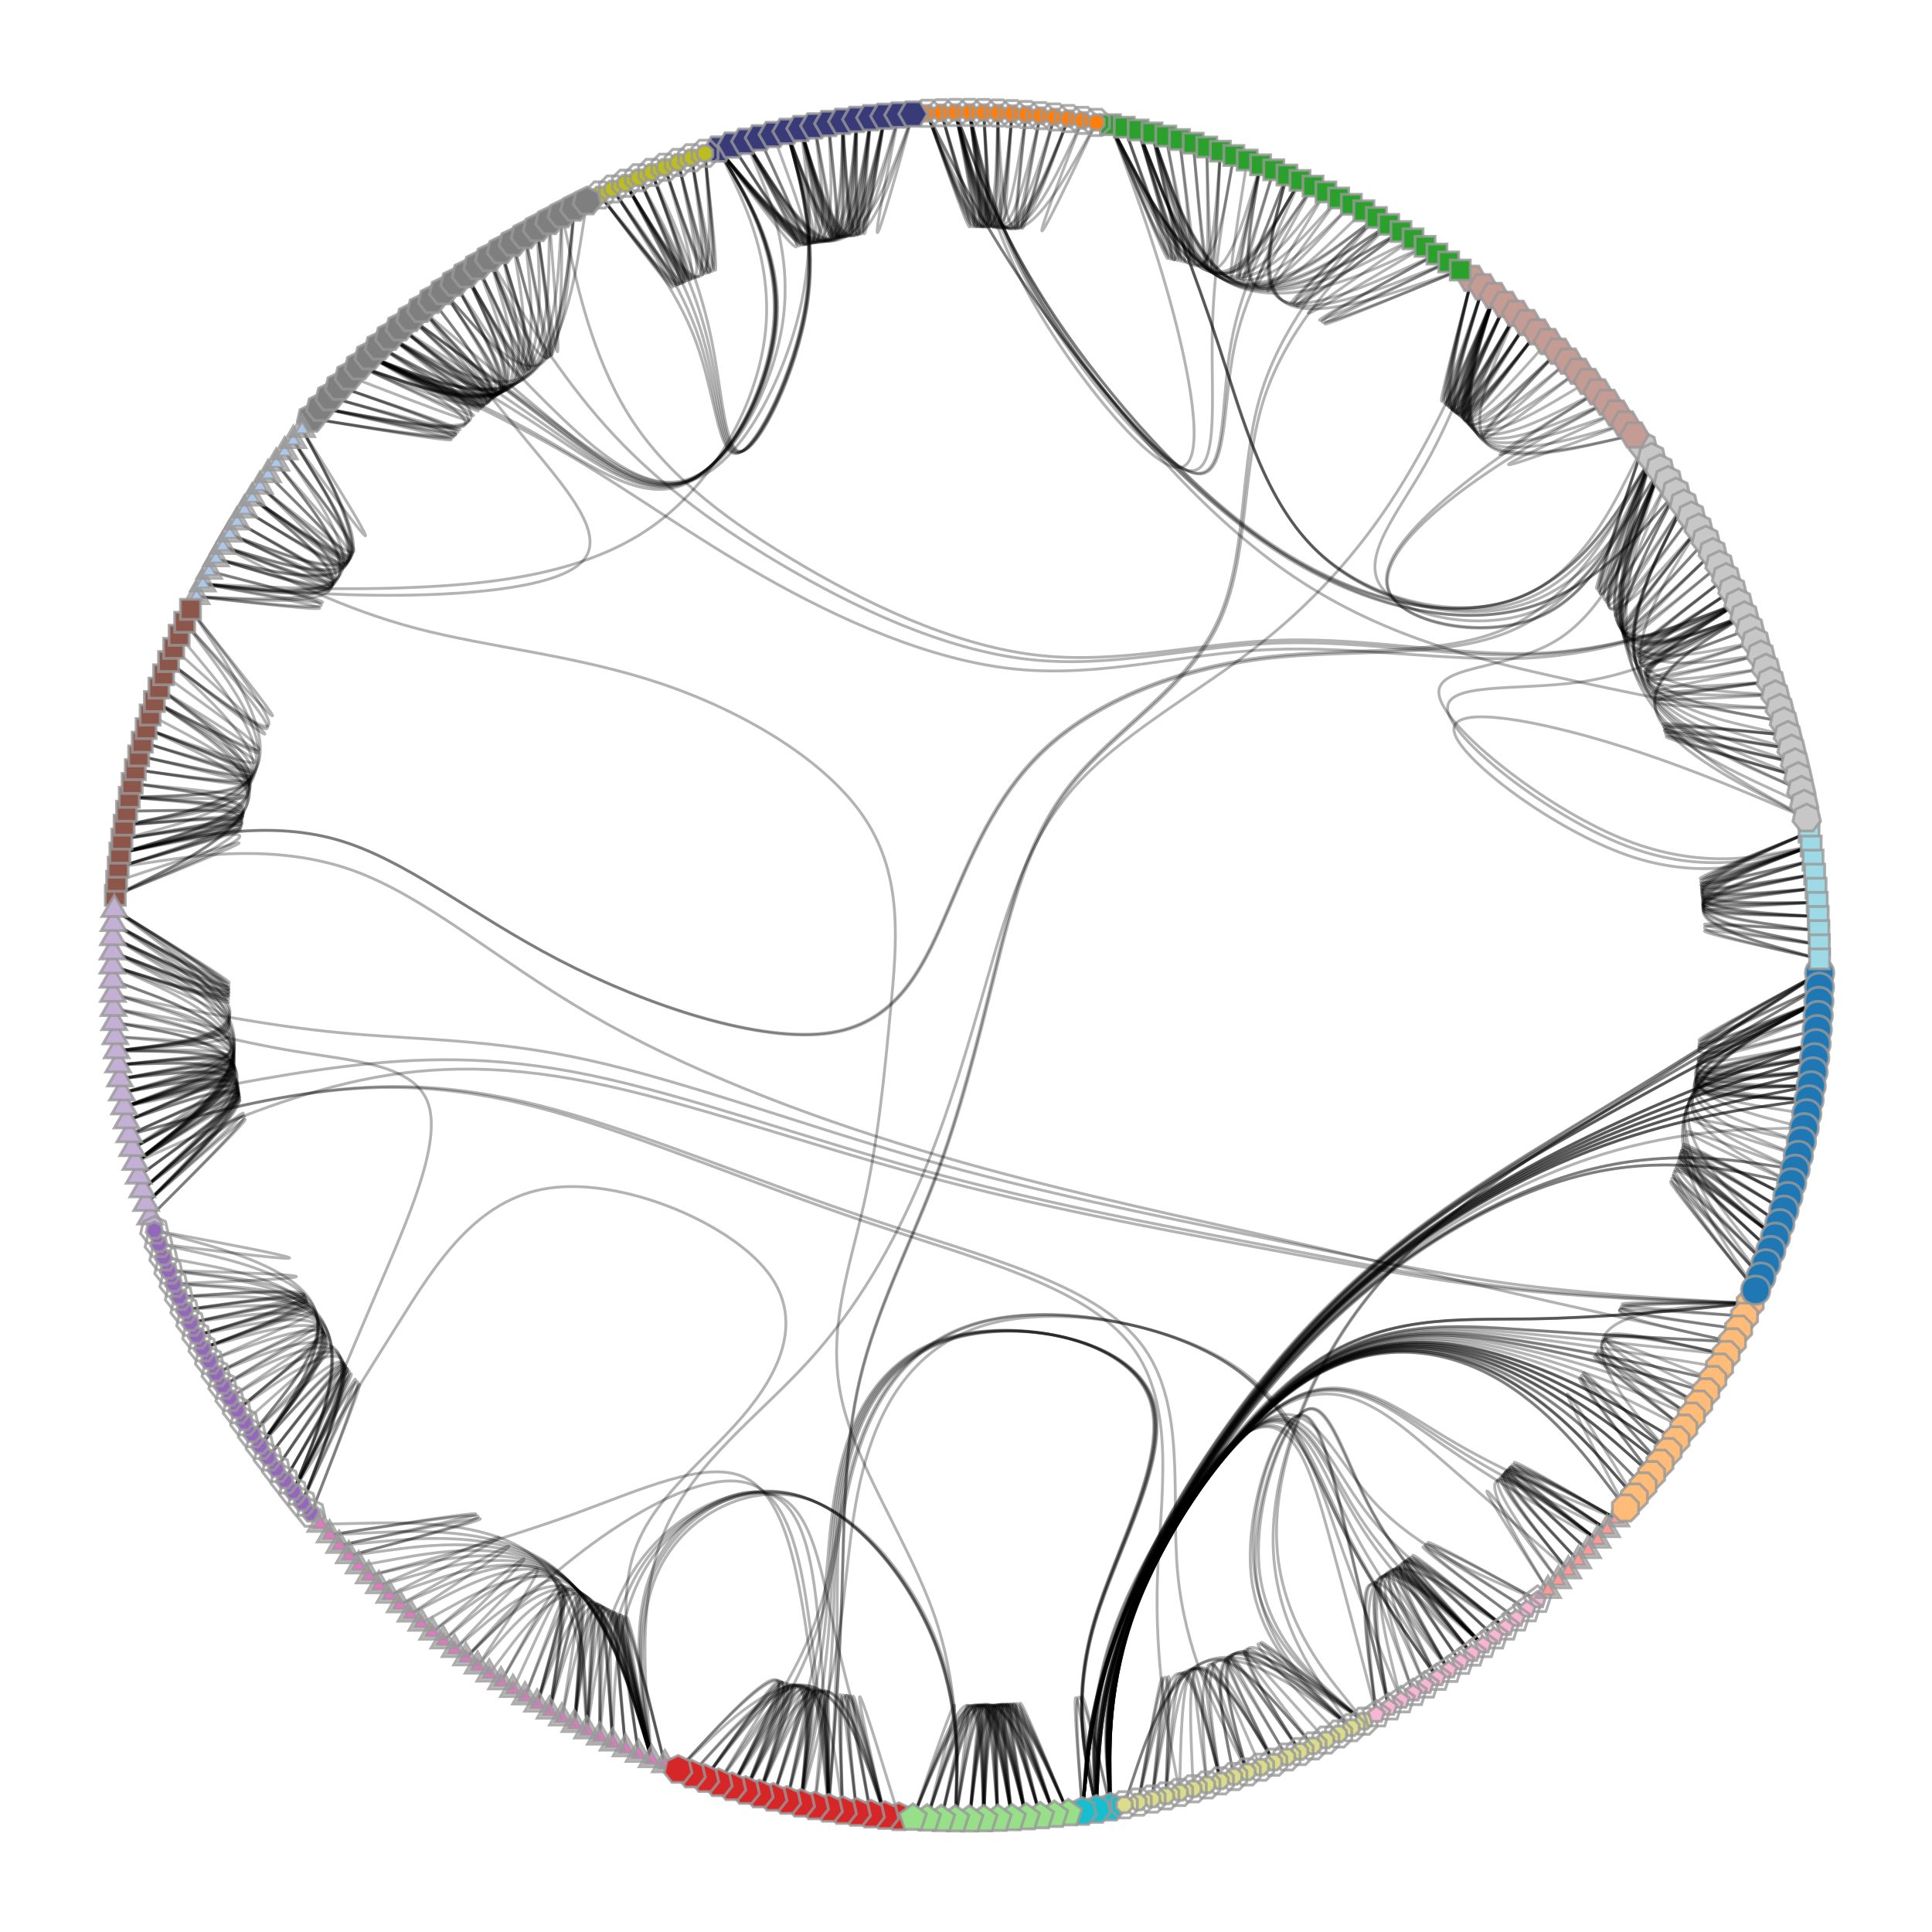
Block partition of a co-authorship network, which minimizes the description length of the network according to the nested (degree-corrected) stochastic blockmodel.#