graphviz_draw#
- graph_tool.draw.graphviz_draw(g, pos=None, size=(15, 15), pin=False, layout=None, maxiter=None, ratio='fill', overlap=True, sep=None, splines=False, vsize=0.105, penwidth=1.0, elen=None, gprops={}, vprops={}, eprops={}, vcolor='#a40000', ecolor='#2e3436', vcmap=None, vnorm=True, ecmap=None, enorm=True, vorder=None, eorder=None, output='', output_format='auto', fork=False, return_string=False)[source]#
Draw a graph using graphviz.
- Parameters:
- g
Graph Graph to be drawn.
- pos
VertexPropertyMapor tuple ofVertexPropertyMap(optional, default:None) Vertex property maps containing the x and y coordinates of the vertices.
- sizetuple of scalars (optional, default:
(15,15)) Size (in centimeters) of the canvas.
- pinbool or
VertexPropertyMap(default:False) If
True, the vertices are not moved from their initial position. If aVertexPropertyMapis passed, it is used to pin nodes individually.- layoutstring (default:
"neato" if g.num_vertices() <= 1000 else "sfdp") Layout engine to be used. Possible values are
"neato","fdp","dot","circo","twopi"and"arf".- maxiterint (default:
None) If specified, limits the maximum number of iterations.
- ratiostring or float (default:
"fill") Sets the aspect ratio (drawing height/drawing width) for the drawing. Note that this is adjusted before the
sizeattribute constraints are enforced.If
ratiois numeric, it is taken as the desired aspect ratio. Then, if the actual aspect ratio is less than the desired ratio, the drawing height is scaled up to achieve the desired ratio; if the actual ratio is greater than that desired ratio, the drawing width is scaled up.If
ratio == "fill"and the size attribute is set, node positions are scaled, separately in both x and y, so that the final drawing exactly fills the specified size.If
ratio == "compress"and the size attribute is set, dot attempts to compress the initial layout to fit in the given size. This achieves a tighter packing of nodes but reduces the balance and symmetry. This feature only works in dot.If
ratio == "expand", the size attribute is set, and both the width and the height of the graph are less than the value in size, node positions are scaled uniformly until at least one dimension fits size exactly. Note that this is distinct from using size as the desired size, as here the drawing is expanded before edges are generated and all node and text sizes remain unchanged.If
ratio == "auto", the page attribute is set and the graph cannot be drawn on a single page, then size is set to an “ideal” value. In particular, the size in a given dimension will be the smallest integral multiple of the page size in that dimension which is at least half the current size. The two dimensions are then scaled independently to the new size. This feature only works in dot.- overlapbool or string (default:
"prism") Determines if and how node overlaps should be removed. Nodes are first enlarged using the sep attribute. If
True, overlaps are retained. If the value is"scale", overlaps are removed by uniformly scaling in x and y. If the value isFalse, node overlaps are removed by a Voronoi-based technique. If the value is"scalexy", x and y are separately scaled to remove overlaps.If sfdp is available, one can set overlap to
"prism"to use a proximity graph-based algorithm for overlap removal. This is the preferred technique, though"scale"andFalsecan work well with small graphs. This technique starts with a small scaling up, controlled by the overlap_scaling attribute, which can remove a significant portion of the overlap. The prism option also accepts an optional non-negative integer suffix. This can be used to control the number of attempts made at overlap removal. By default,overlap == "prism"is equivalent tooverlap == "prism1000". Settingoverlap == "prism0"causes only the scaling phase to be run.If the value is
"compress", the layout will be scaled down as much as possible without introducing any overlaps, obviously assuming there are none to begin with.- sepfloat (default:
None) Specifies margin to leave around nodes when removing node overlap. This guarantees a minimal non-zero distance between nodes.
- splinesbool (default:
False) If
True, the edges are drawn as splines and routed around the vertices.- vsizefloat,
VertexPropertyMap, or tuple (default:0.105) Default vertex size (width and height). If a tuple is specified, the first value should be a property map, and the second is a scale factor.
- penwidthfloat,
EdgePropertyMapor tuple (default:1.0) Specifies the width of the pen, in points, used to draw lines and curves, including the boundaries of edges and clusters. It has no effect on text. If a tuple is specified, the first value should be a property map, and the second is a scale factor.
- elenfloat or
EdgePropertyMap(default:None) Preferred edge length, in inches.
- gpropsdict (default:
{}) Additional graph properties, as a dictionary. The keys are the property names, and the values must be convertible to string.
- vpropsdict (default:
{}) Additional vertex properties, as a dictionary. The keys are the property names, and the values must be convertible to string, or vertex property maps, with values convertible to strings.
- epropsdict (default:
{}) Additional edge properties, as a dictionary. The keys are the property names, and the values must be convertible to string, or edge property maps, with values convertible to strings.
- vcolorstring or
VertexPropertyMap(default:"#a40000") Drawing color for vertices. If the valued supplied is a property map, the values must be scalar types, whose color values are obtained from the
vcmapargument.- ecolorstring or
EdgePropertyMap(default:"#2e3436") Drawing color for edges. If the valued supplied is a property map, the values must be scalar types, whose color values are obtained from the
ecmapargument.- vcmap
matplotlib.colors.Colormap(default:matplotlib.cm.jet) Vertex color map.
- vnormbool (default:
True) Normalize vertex color values to the [0,1] range.
- ecmap
matplotlib.colors.Colormap(default:matplotlib.cm.jet) Edge color map.
- enormbool (default:
True) Normalize edge color values to the [0,1] range.
- vorder
PropertyMap(default:None) Scalar vertex property map which specifies the order with which vertices are drawn.
- eorder
VertexPropertyMap(default:None) Scalar edge property map which specifies the order with which edges are drawn.
- outputstring (default:
"") Output file name. If
Nonethen no output is produced.- output_formatstring (default:
"auto") Output file format. Possible values are
"auto","xlib","ps","svg","svgz","fig","mif","hpgl","pcl","png","gif","dia","imap","cmapx". If the value is"auto", the format is guessed from theoutputparameter, orxlibif it is empty.- forkbool (default:
False) If
True, the program is forked before drawing. This is used as a work-around for a bug in graphviz, where theexit()function is called, which would cause the calling program to end. This is always assumedTrue, ifoutput_format == 'xlib'.- return_stringbool (default:
False) If
True, a string containing the rendered graph as binary data is returned (defaults to png format).
- g
- Returns:
- pos
VertexPropertyMap Vector vertex property map with the x and y coordinates of the vertices.
- gvgv.digraph or gv.graph (optional, only if
returngv == True) Internally used graphviz graph.
- pos
Notes
This function is a wrapper for the [graphviz] routines. Extensive additional documentation for the graph, vertex and edge properties is available at: http://www.graphviz.org/doc/info/attrs.html.
References
Examples
>>> g = gt.price_network(1500)
>>> deg = g.degree_property_map("in")
>>> deg.a = 2 * (sqrt(deg.a) * 0.5 + 0.4)
>>> ebet = gt.betweenness(g)[1]
>>> gt.graphviz_draw(g, vcolor=deg, vorder=deg, elen=10,
...                  ecolor=ebet, eorder=ebet, output="graphviz-draw.pdf")
<...>
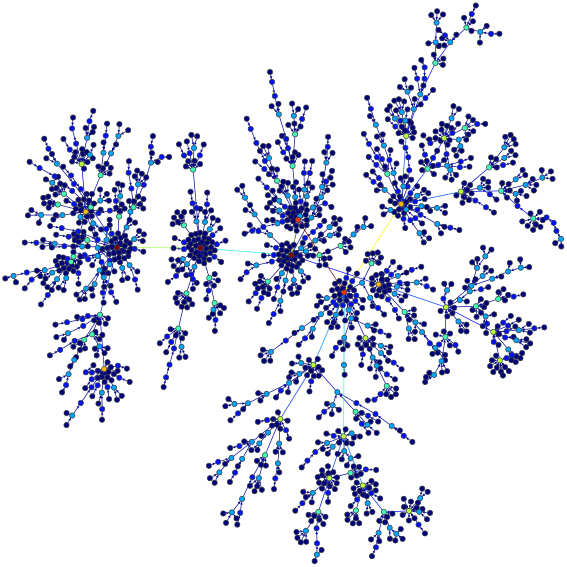
Kamada-Kawai force-directed layout of a Price network with 1500 nodes. The vertex size and color indicate the degree, and the edge color corresponds to the edge betweenness centrality#