sfdp_layout#
- graph_tool.draw.sfdp_layout(g, vweight=None, eweight=None, pin=None, C=0.2, K=None, p=2.0, theta=0.6, max_level=15, r=1.0, kc=10, groups=None, gamma=0.1, mu=2.0, kappa=1.0, rmap=None, R=1, init_step=None, cooling_step=0.95, adaptive_cooling=True, epsilon=0.01, max_iter=0, pos=None, multilevel=None, coarse_method='hybrid', mivs_thres=0.9, ec_thres=0.75, weighted_coarse=False, verbose=False)[source]#
Obtain the SFDP spring-block layout of the graph.
- Parameters:
- g
Graph Graph to be used.
- vweight
VertexPropertyMap(optional, default:None) A vertex property map with the respective weights.
- eweight
EdgePropertyMap(optional, default:None) An edge property map with the respective weights.
- pin
VertexPropertyMap(optional, default:None) A vertex property map with boolean values, which, if given, specify the vertices which will not have their positions modified.
- Cfloat (optional, default:
0.2) Relative strength of repulsive forces.
- Kfloat (optional, default:
None) Optimal edge length. If not provided, it will be taken to be the average edge distance in the initial layout.
- pfloat (optional, default:
2) Repulsive force exponent.
- thetafloat (optional, default:
0.6) Quadtree opening parameter, a.k.a. Barnes-Hut opening criterion.
- max_levelint (optional, default:
15) Maximum quadtree level.
- rfloat (optional, default:
1.) Strength of attractive force between connected components.
- kcint (optional, default:
10) Number of connected components to subsample.
- groups
VertexPropertyMapor list of list of integers (optional, default:None) A vertex property map with group assignments. Vertices belonging to the same group will be put close together. Optionally, this can take an hierarchical partition, represented by a list of lists, where the list above correspond to the partition of the list below.
- gammafloat or list of floats (optional, default:
.1) Strength of the attractive force between nodes of the same group to their center of mass. In case of a hierarchical partition, this should correspond to a list of floats, containing the strenghts for each hierarchical level. This option has no effect if
groupsisNone.- rmap
VertexPropertyMap(optional, default:None) Vertex rank to be used around to order them preferentially in the \(y\) direction.
- Rfloat (optional, default:
1.0) Strength of the rank ordering in the \(y\) direction.
- init_stepfloat (optional, default:
None) Initial update step. If not provided, it will be chosen automatically.
- cooling_stepfloat (optional, default:
0.95) Cooling update step.
- adaptive_coolingbool (optional, default:
True) Use an adaptive cooling scheme.
- epsilonfloat (optional, default:
0.01) Relative convergence criterion.
- max_iterint (optional, default:
0) Maximum number of iterations. If this value is
0, it runs until convergence.- pos
VertexPropertyMap(optional, default:None) Initial vertex layout. If not provided, it will be randomly chosen.
- multilevelbool (optional, default:
None) Use a multilevel layout algorithm. If
Noneis given, it will be activated based on the size of the graph.- coarse_methodstr (optional, default:
"hybrid") Coarsening method used if
multilevel == True. Allowed methods are"hybrid","mivs"and"ec".- mivs_thresfloat (optional, default:
0.9) If the relative size of the MIVS coarse graph is above this value, the coarsening stops.
- ec_thresfloat (optional, default:
0.75) If the relative size of the EC coarse graph is above this value, the coarsening stops.
- weighted_coarsebool (optional, default:
False) Use weighted coarse graphs.
- verbosebool (optional, default:
False) Provide verbose information.
- g
- Returns:
- pos
VertexPropertyMap A vector-valued vertex property map with the coordinates of the vertices.
- pos
Notes
This algorithm is defined in [hu-multilevel-2005], and has complexity \(O(V\log V)\).
References
[hu-multilevel-2005]Yifan Hu, “Efficient and High Quality Force-Directed Graph”, Mathematica Journal, vol. 10, Issue 1, pp. 37-71, (2005) http://www.mathematica-journal.com/issue/v10i1/graph_draw.html
Examples
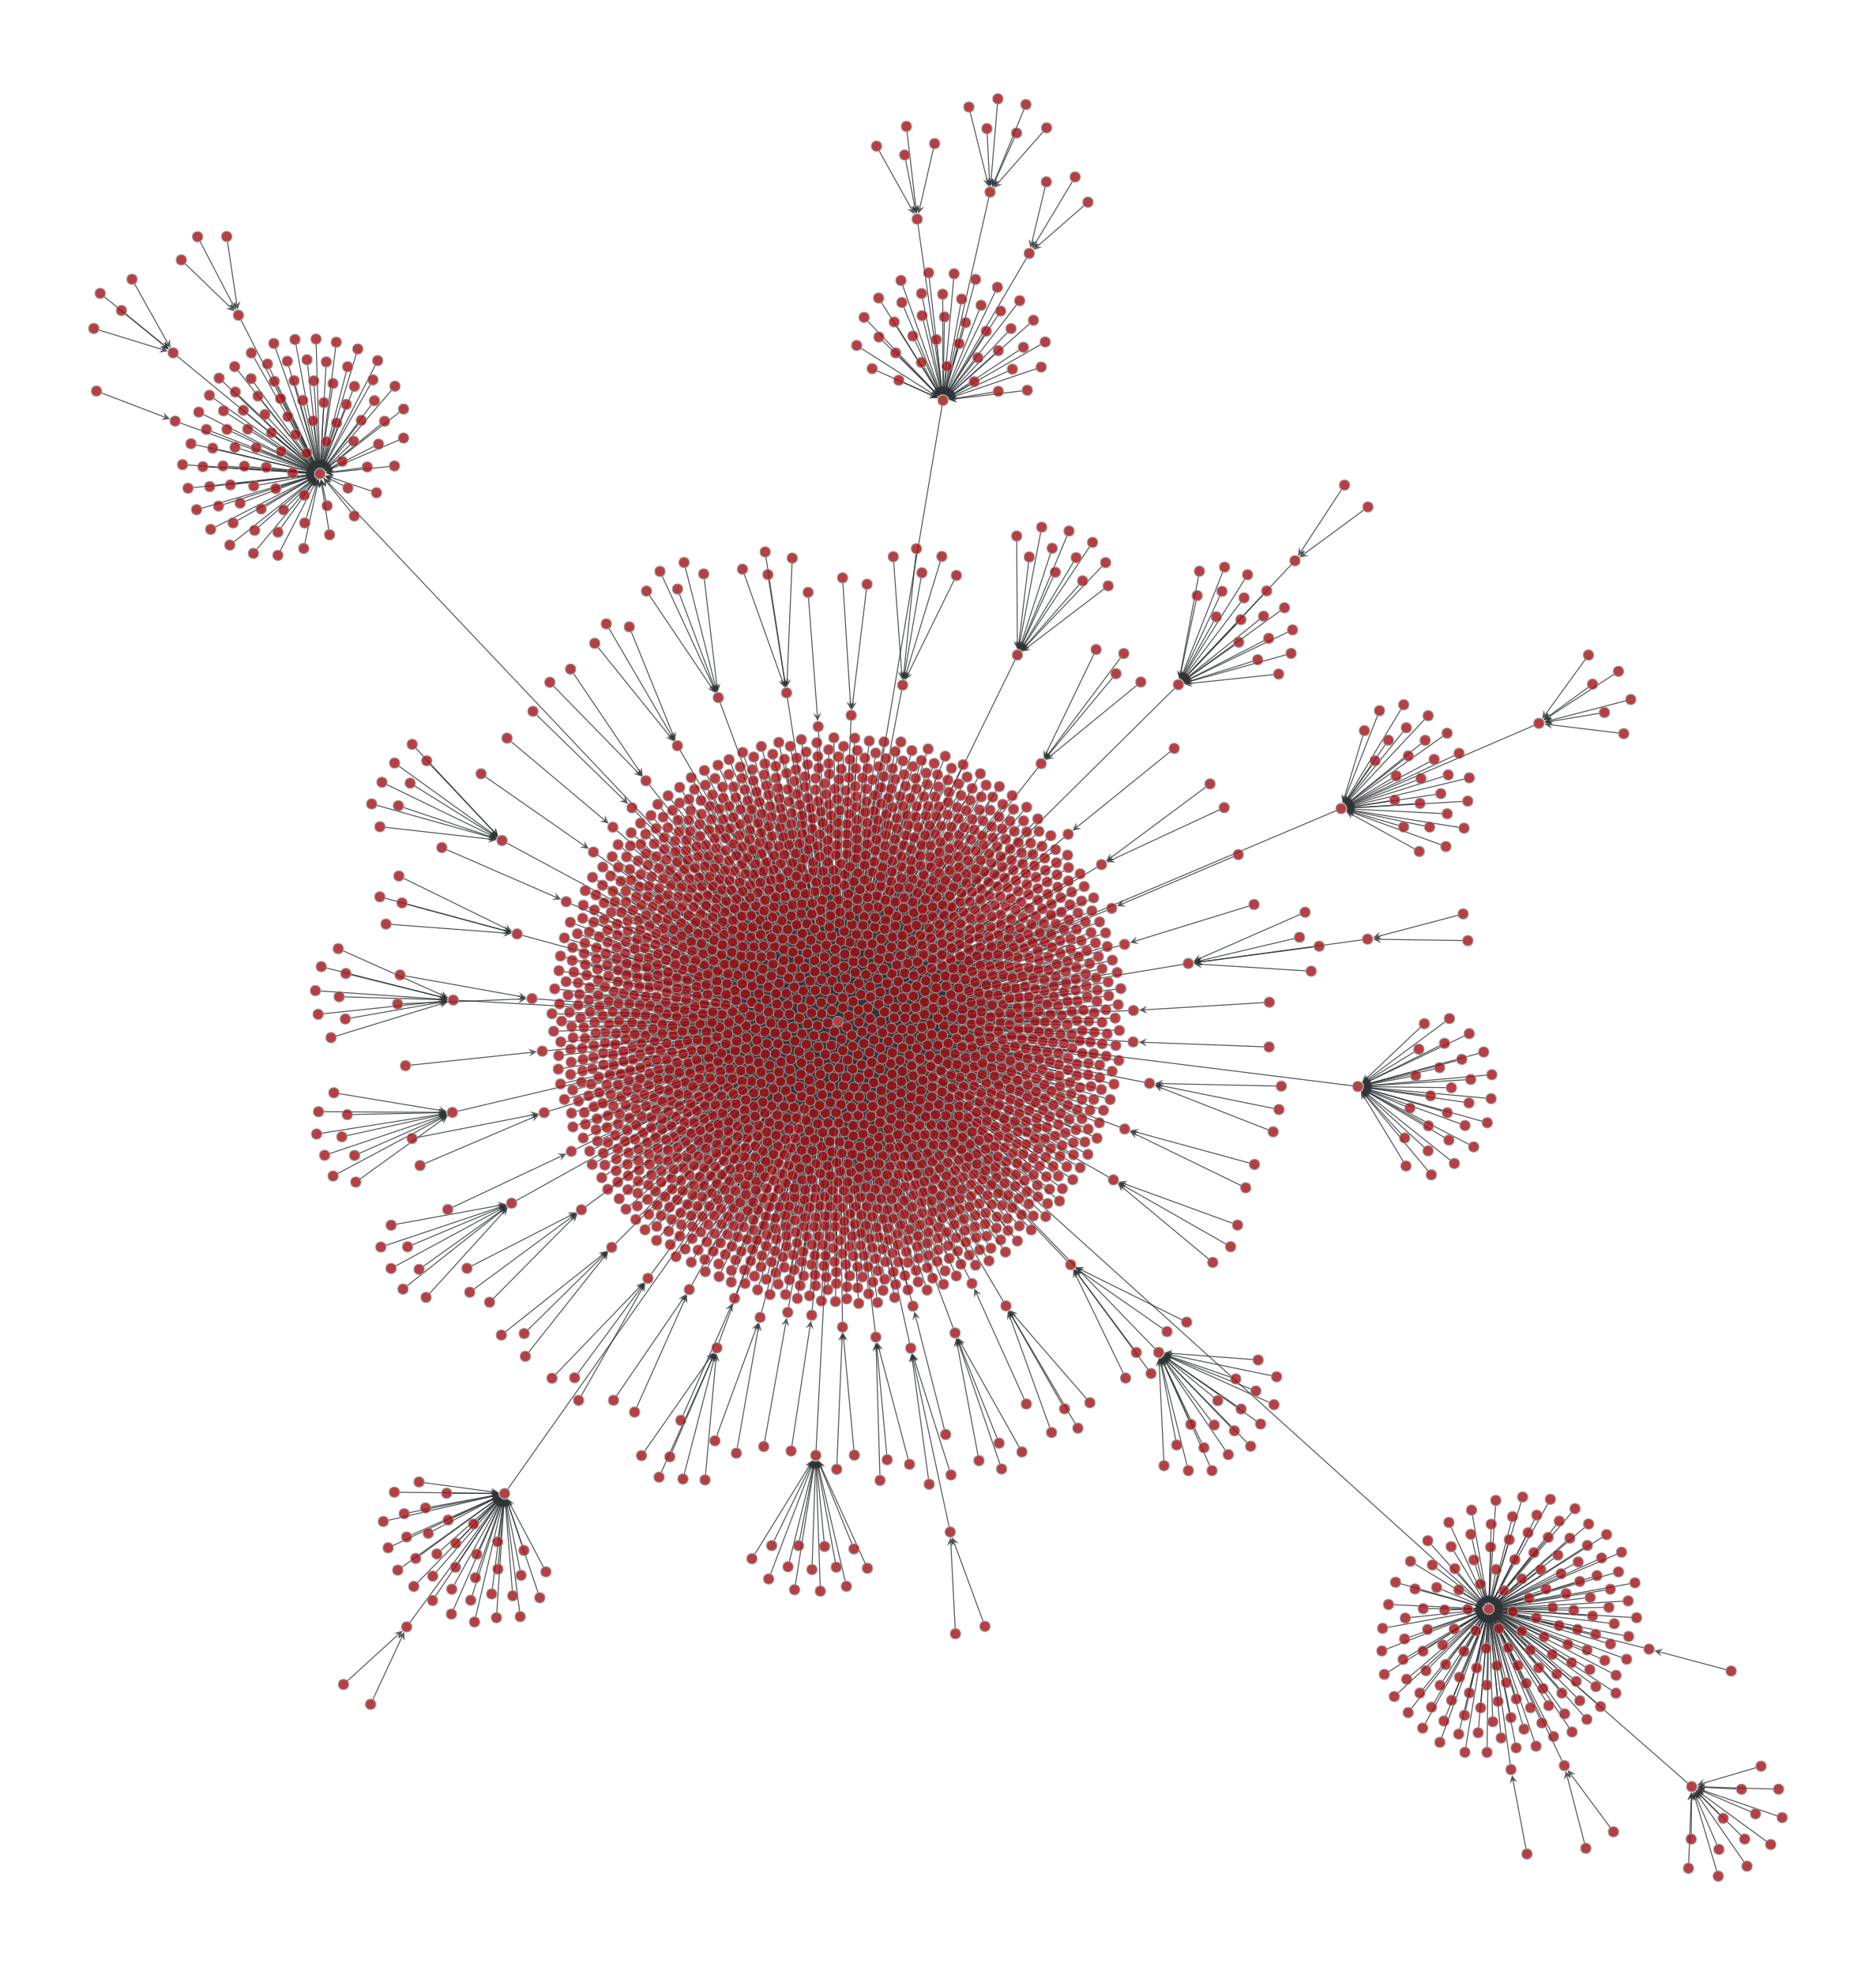
>>> g = gt.price_network(3000)
>>> pos = gt.sfdp_layout(g)
>>> gt.graph_draw(g, pos=pos, output="graph-draw-sfdp.pdf")
<...>

SFDP layout of a Price network.#