graph_projection#
- graph_tool.generation.graph_projection(g, p, proj_props=[], props=[])[source]#
Return the projection of selected vertices on the remaning vertices.
- Parameters:
- g
Graph Graph to be projected.
- p
VertexPropertyMap Vertex property map indicating the vertices that should be projected. A value convertible to
True(i.e. a nonzero scalar value) indicates that the vertex should be projected.- proj_propslist of
VertexPropertyMapobjects (optional, default:[]) Vertex property maps to be included as edge property maps in the projection.
- propslist of
PropertyMap(optional, default:[]) Property maps to be included the projection, for nodes and edges not participating in the projection.
- g
- Returns:
- pg
Graph The projected graph.
- nproj_propslist of
EdgePropertyMapobjects List of edge properties in the projected graph. This is only returned if proj_props is not empty.
- npropslist of
PropertyMapobjects List of properties in the projected graph, for nodes and edges not participating in the projection. This is only returned if props is not empty.
- pg
Notes
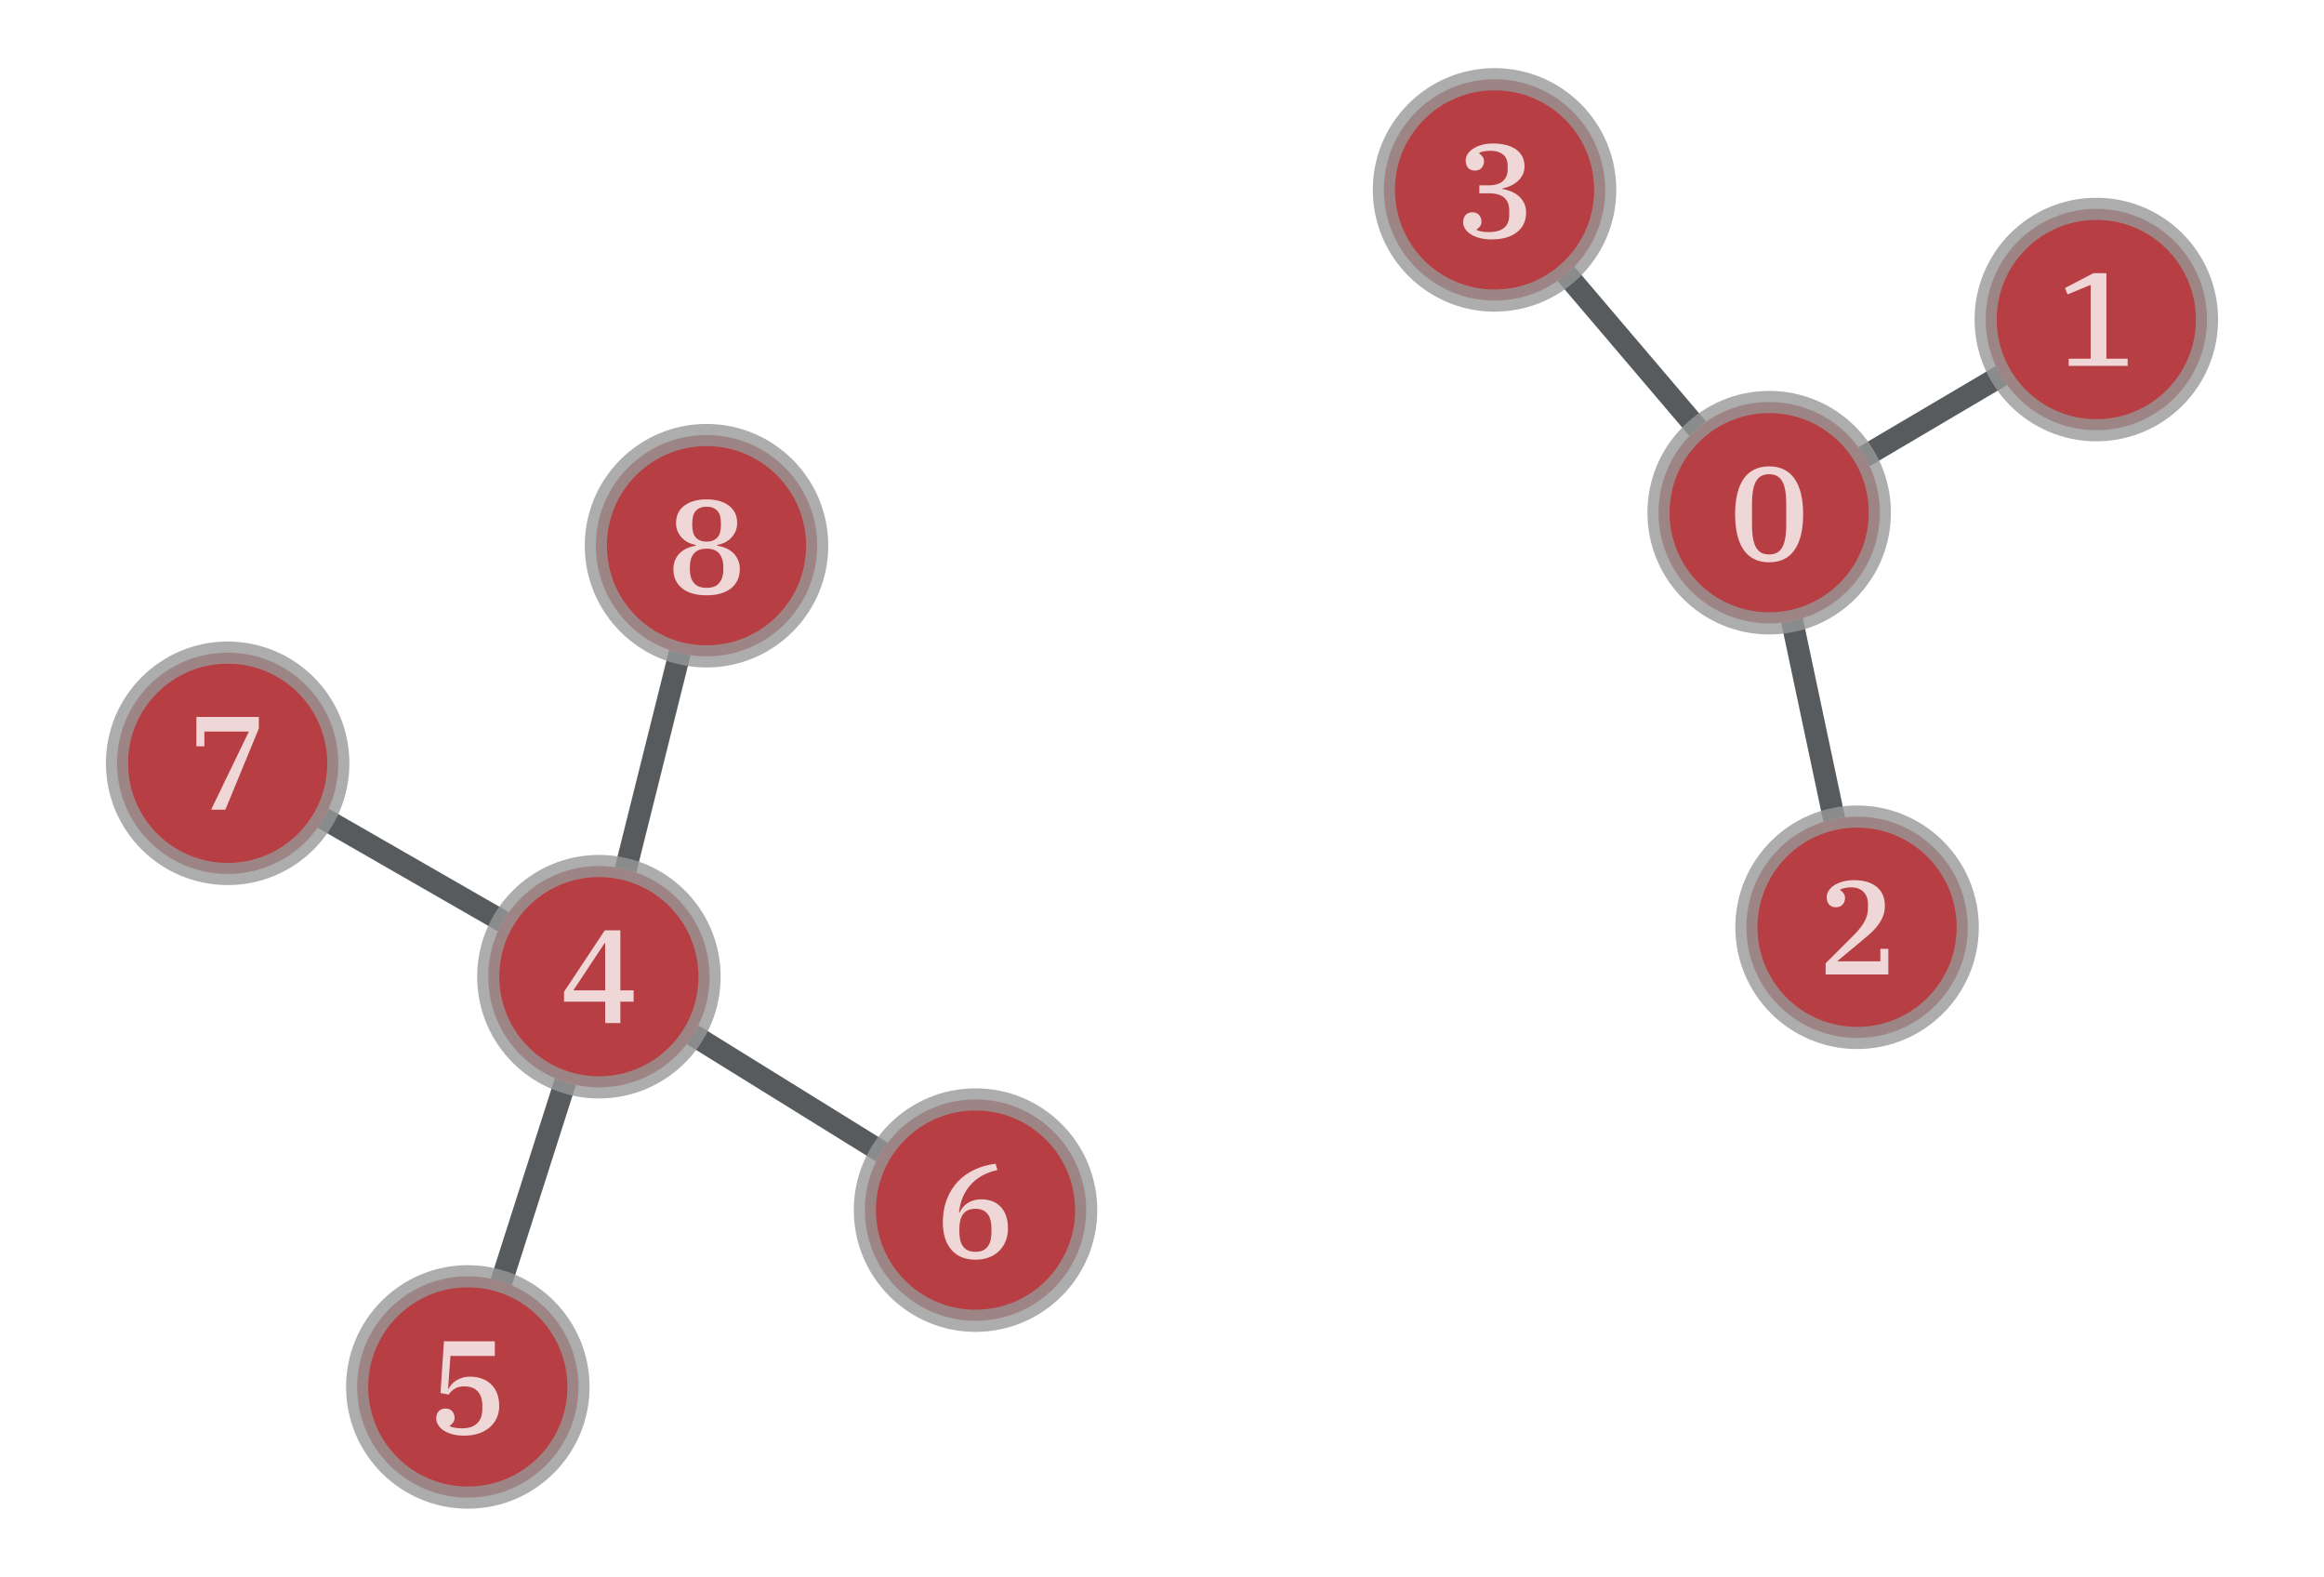
A vertex is projected when it’s removed from the graph, and its neighbours are connected to form a clique.
In the case of directed graphs, an edge \(u\to v\) exists in the projected graph if a path \(u\to w\to v\) exists in the original graph for a projected vertex \(w\).
The original graph does not need to be bipartite. Edges not involved in the projection are preserved.
This algorithm runs in time \(O(N + E + N_p\left<k^2\right>)\), where \(N\) and \(E\) are the number of vertices and edges, respectively, \(N_p\) is the number of vertices to be projected, and \(\left<k^2\right>\) is their average squared degree.
Examples
>>> g = gt.Graph({0: (1,2,3), 4: (5,6,7,8)}, directed=False)
>>> p = g.new_vp("bool", vals=[v in [0, 4] for v in g.vertices()])
>>> pos = gt.sfdp_layout(g)
>>> pg, props = gt.graph_projection(g, p, props=[g.vertex_index, pos])
>>> gt.graph_draw(g, pos=pos, vertex_text=g.vertex_index, output="bipartite_orig.pdf")
<...>
>>> gt.graph_draw(pg, pos=props[1], vertex_text=props[0], output="projection.pdf")
<...>

