fruchterman_reingold_layout#
- graph_tool.draw.fruchterman_reingold_layout(g, weight=None, a=None, r=1.0, scale=None, circular=False, grid=True, t_range=None, n_iter=100, pos=None)[source]#
Calculate the Fruchterman-Reingold spring-block layout of the graph.
- Parameters:
- g
Graph Graph to be used.
- weight
EdgePropertyMap(optional, default:None) An edge property map with the respective weights.
- afloat (optional, default: \(V\))
Attracting force between adjacent vertices.
- rfloat (optional, default: 1.0)
Repulsive force between vertices.
- scalefloat (optional, default: \(\sqrt{V}\))
Total scale of the layout (either square side or radius).
- circularbool (optional, default:
False) If
True, the layout will have a circular shape. Otherwise the shape will be a square.- gridbool (optional, default:
True) If
True, the repulsive forces will only act on vertices which are on the same site on a grid. Otherwise they will act on all vertex pairs.- t_rangetuple of floats (optional, default:
(scale / 10, scale / 1000)) Temperature range used in annealing. The temperature limits the displacement at each iteration.
- n_iterint (optional, default:
100) Total number of iterations.
- pos
VertexPropertyMap(optional, default:None) Vector vertex property maps where the coordinates should be stored. If provided, this will also be used as the initial position of the vertices.
- g
- Returns:
- pos
VertexPropertyMap A vector-valued vertex property map with the coordinates of the vertices.
- pos
Notes
This algorithm is defined in [fruchterman-reingold], and has complexity \(O(\text{n-iter}\times V^2)\) if grid=False or \(O(\text{n-iter}\times (V + E))\) otherwise.
References
[fruchterman-reingold]Fruchterman, Thomas M. J.; Reingold, Edward M. “Graph Drawing by Force-Directed Placement”. Software - Practice & Experience (Wiley) 21 (11): 1129-1164. (1991) DOI: 10.1002/spe.4380211102 [sci-hub, @tor]
Examples
>>> g = gt.price_network(300)
>>> pos = gt.fruchterman_reingold_layout(g, n_iter=1000)
>>> gt.graph_draw(g, pos=pos, output="graph-draw-fr.pdf")
<...>
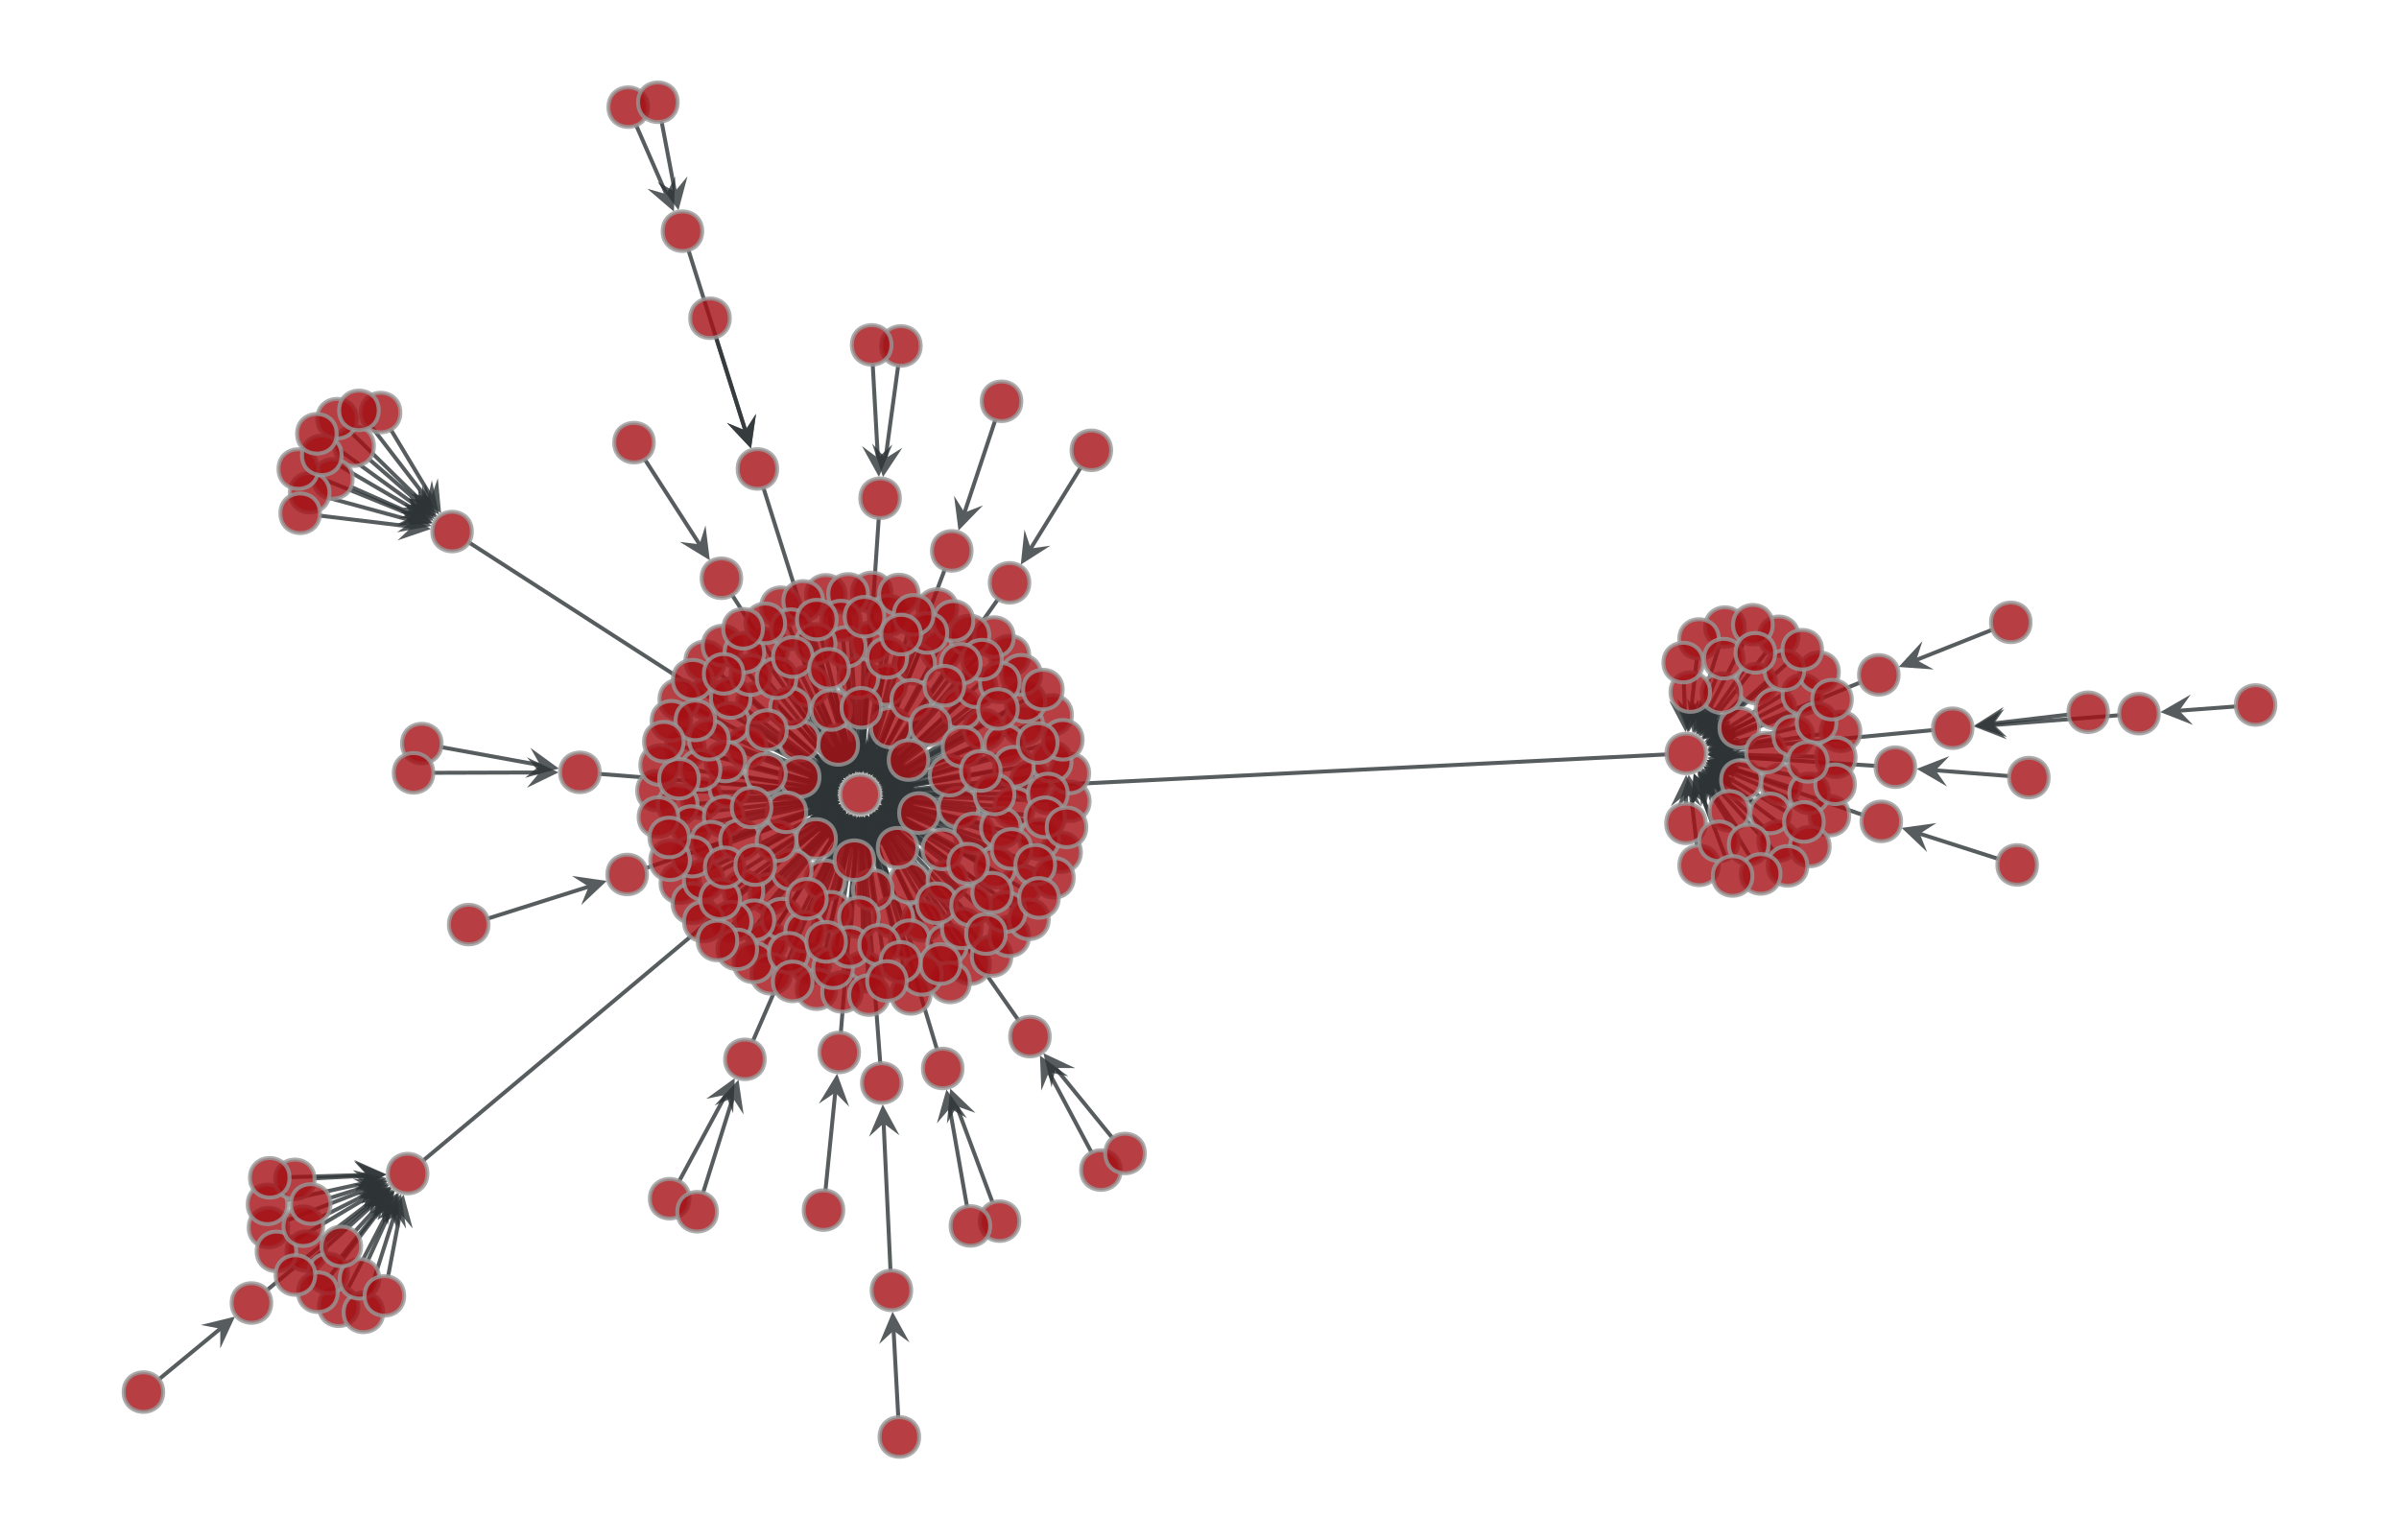
Fruchterman-Reingold layout of a Price network.#