graph_draw#
- graph_tool.draw.graph_draw(g, pos=None, vprops=None, eprops=None, vorder=None, eorder=None, nodesfirst=False, output_size=(600, 600), fit_view=True, fit_view_ink=None, adjust_aspect=True, ink_scale=1, inline=False, inline_scale=2, mplfig=None, yflip=True, output=None, fmt='auto', bg_color=None, antialias=None, **kwargs)[source]#
Draw a graph to screen or to a file using
cairo.- Parameters:
- g
Graph Graph to be drawn.
- pos
VertexPropertyMap(optional, default:None) Vector-valued vertex property map containing the x and y coordinates of the vertices. If not given, it will be computed using
sfdp_layout().- vpropsdict (optional, default:
None) Dictionary with the vertex properties. Individual properties may also be given via the
vertex_<prop-name>parameters, where<prop-name>is the name of the property.- epropsdict (optional, default:
None) Dictionary with the edge properties. Individual properties may also be given via the
edge_<prop-name>parameters, where<prop-name>is the name of the property.- vorder
VertexPropertyMap(optional, default:None) If provided, defines the relative order in which the vertices are drawn.
- eorder
EdgePropertyMap(optional, default:None) If provided, defines the relative order in which the edges are drawn.
- nodesfirstbool (optional, default:
False) If
True, the vertices are drawn first, otherwise the edges are.- output_sizetuple of scalars (optional, default:
(600,600)) Size of the drawing canvas. The units will depend on the output format (pixels for the screen, points for PDF, etc).
- fit_viewbool, float or tuple (optional, default:
True) If
True, the layout will be scaled to fit the entire clip region. If a float value is given, it will be interpreted asTrue, and in addition the viewport will be scaled out by that factor. If a tuple value is given, it should have four values(x, y, w, h)that specify the view in user coordinates.- fit_view_inkbool (optional, default:
None) If
True, andfit_view == Truethe drawing will be performed once to figure out the bounding box, before the actual drawing is made. Otherwise, only the vertex positions will be used for this purpose. If the value isNone, then it will be assumedTruefor networks of size 10,000 nodes or less, otherwise it will be assumedFalse.- adjust_aspectbool (optional, default:
True) If
True, andfit_view == Truethe output size will be decreased in the width or height to remove empty spaces.- ink_scalefloat (optional, default:
1.) Scale all sizes and widths by this factor.
- inlinebool (optional, default:
False) If
Trueand an IPython notebook is being used, an inline version of the drawing will be returned.- inline_scalefloat (optional, default:
2.): Resolution scaling factor for inline images.
- mplfig
matplotlibcontainer object (optional, default:None) The
mplfigobject needs to have anadd_artist()function. This can for example be amatplotlib.figure.Figureormatplotlib.axes.Axes. Only the cairo backend is supported; useswitch_backend('cairo'). If this option is used, aGraphArtistobject is returned.- yflipbool (optional, default:
True) If
mplfig is not None, andfit_view != False, then the y direction of the axis will be flipped, reproducing the same output as whenmplfig is None.- outputstring or file object (optional, default:
None) Output file name (or object). If not given, the graph will be displayed via
interactive_window().- fmtstring (default:
"auto") Output file format. Possible values are
"auto","ps","pdf","svg", and"png". If the value is"auto", the format is guessed from theoutputparameter.- bg_colorstr or sequence (optional, default:
None) Background color. The default is transparent.
- antialias
cairo.Antialias(optional, default:None) If supplied, this will set the antialising mode of the cairo context.
- vertex_*
VertexPropertyMapor arbitrary types (optional, default:None) Parameters following the pattern
vertex_<prop-name>specify the vertex property with name<prop-name>, as an alternative to thevpropsparameter.- edge_*
EdgePropertyMapor arbitrary types (optional, default:None) Parameters following the pattern
edge_<prop-name>specify the edge property with name<prop-name>, as an alternative to theepropsparameter.- **kwargs
Any extra parameters are passed to
interactive_window(),GraphWindow,GraphWidgetandcairo_draw().
- g
- Returns:
- pos
VertexPropertyMap Vector vertex property map with the x and y coordinates of the vertices.
- selected
VertexPropertyMap(optional, only ifoutput is None) Boolean-valued vertex property map marking the vertices which were selected interactively.
- pos
Notes
List of vertex properties
Name
Description
Accepted types
Default Value
shape
The vertex shape. Can be one of the following strings: “circle”, “triangle”, “square”, “pentagon”, “hexagon”, “heptagon”, “octagon” “double_circle”, “double_triangle”, “double_square”, “double_pentagon”, “double_hexagon”, “double_heptagon”, “double_octagon”, “pie”, “none”. Optionally, this might take a numeric value corresponding to position in the list above.
strorint"circle"color
Color used to stroke the lines of the vertex.
stror list offloats[0., 0., 0., 1]fill_color
Color used to fill the interior of the vertex.
stror list offloats[0.640625, 0, 0, 0.9]size
The size of the vertex, in the default units of the output format (normally either pixels or points).
floatorint5aspect
The aspect ratio of the vertex.
floatorint1.0rotation
Angle (in radians) to rotate the vertex.
float0.anchor
Specifies how the edges anchor to the vertices. If 0, the anchor is at the center of the vertex, otherwise it is at the border.
int1pen_width
Width of the lines used to draw the vertex, in the default units of the output format (normally either pixels or points).
floatorint0.8halo
Whether to draw a circular halo around the vertex.
boolFalsehalo_color
Color used to draw the halo.
stror list offloats[0., 0., 1., 0.5]halo_size
Relative size of the halo.
float1.5text
Text to draw together with the vertex.
str""text_color
Color used to draw the text. If the value is
"auto", it will be computed based on fill_color to maximize contrast.stror list offloats"auto"text_position
Position of the text relative to the vertex. If the passed value is positive, it will correspond to an angle in radians, which will determine where the text will be placed outside the vertex. If the value is negative, the text will be placed inside the vertex. If the value is
-1, the vertex size will be automatically increased to accommodate the text. The special value"centered"positions the texts rotated radially around the center of mass.floatorintor
"centered"
-1text_offset
Text position offset.
list of
float[0.0, 0.0]text_rotation
Angle of rotation (in radians) for the text. The center of rotation is the position of the vertex.
float0.0text_out_color
Color used to draw the text outline.
stror list offloats[0,0,0,0]text_out_width
Width of the text outline.
float1.font_family
Font family used to draw the text.
str"serif"font_slant
Font slant used to draw the text.
cairo.FONT_SLANT_*font_weight
Font weight used to draw the text.
cairo.FONT_WEIGHT_*font_size
Font size used to draw the text.
floatorint12surface
The cairo surface used to draw the vertex. If the value passed is a string, it is interpreted as an image file name to be loaded.
cairo.SurfaceorstrNonepie_fractions
Fractions of the pie sections for the vertices if
shape=="pie".list of
intorfloat[0.75, 0.25]pie_colors
Colors used in the pie sections if
shape=="pie".list of strings or
float.('b','g','r','c','m','y','k')List of edge properties
Name
Description
Accepted types
Default Value
color
Color used to stroke the edge lines.
stror list of floats[0.179, 0.203, 0.210, 0.8]pen_width
Width of the line used to draw the edge, in the default units of the output format (normally either pixels or points).
floatorint1.0start_marker, mid_marker, end_marker
Edge markers. Can be one of “none”, “arrow”, “circle”, “square”, “diamond”, or “bar”. Optionally, this might take a numeric value corresponding to position in the list above.
strorintnonemid_marker_pos
Relative position of the middle marker.
float0.5marker_size
Size of edge markers, in units appropriate to the output format (normally either pixels or points).
floatorint4control_points
Control points of a Bézier spline used to draw the edge. Each spline segment requires 6 values corresponding to the (x,y) coordinates of the two intermediary control points and the final point.
sequence of
floats[]gradient
Stop points of a linear gradient used to stroke the edge. Each group of 5 elements is interpreted as
[o, r, g, b, a]whereois the offset in the range [0, 1] and the remaining values specify the colors.sequence of
floats[]dash_style
Dash pattern is specified by an array of positive values. Each value provides the length of alternate “on” and “off” portions of the stroke. The last value specifies an offset into the pattern at which the stroke begins.
sequence of
floats[]text
Text to draw next to the edges.
str""text_color
Color used to draw the text.
stror list offloats[0., 0., 0., 1.]text_distance
Distance from the edge and its text.
floatorint4text_parallel
If
Truethe text will be drawn parallel to the edges.boolTruetext_out_color
text_out_width
Color used to draw the text outline.
stror list offloats[0,0,0,0]Width of the text outline.
float1.font_family
Font family used to draw the text.
str"serif"font_slant
Font slant used to draw the text.
cairo.FONT_SLANT_*font_weight
Font weight used to draw the text.
cairo.FONT_WEIGHT_*font_size
Font size used to draw the text.
floatorint12Examples
>>> g = gt.price_network(1500)
>>> deg = g.degree_property_map("in")
>>> deg.a = 4 * (sqrt(deg.a) * 0.5 + 0.4)
>>> ebet = gt.betweenness(g)[1]
>>> ebet.a /= ebet.a.max() / 10.
>>> eorder = ebet.copy()
>>> eorder.a *= -1
>>> pos = gt.sfdp_layout(g)
>>> control = g.new_edge_property("vector<double>")
>>> for e in g.edges():
...     d = sqrt(sum((pos[e.source()].a - pos[e.target()].a) ** 2)) / 5
...     control[e] = [0.3, d, 0.7, d]
>>> gt.graph_draw(g, pos=pos, vertex_size=deg, vertex_fill_color=deg, vorder=deg,
...               edge_color=ebet, eorder=eorder, edge_pen_width=ebet,
...               edge_control_points=control, # some curvy edges
...               output="graph-draw.pdf")
<...>
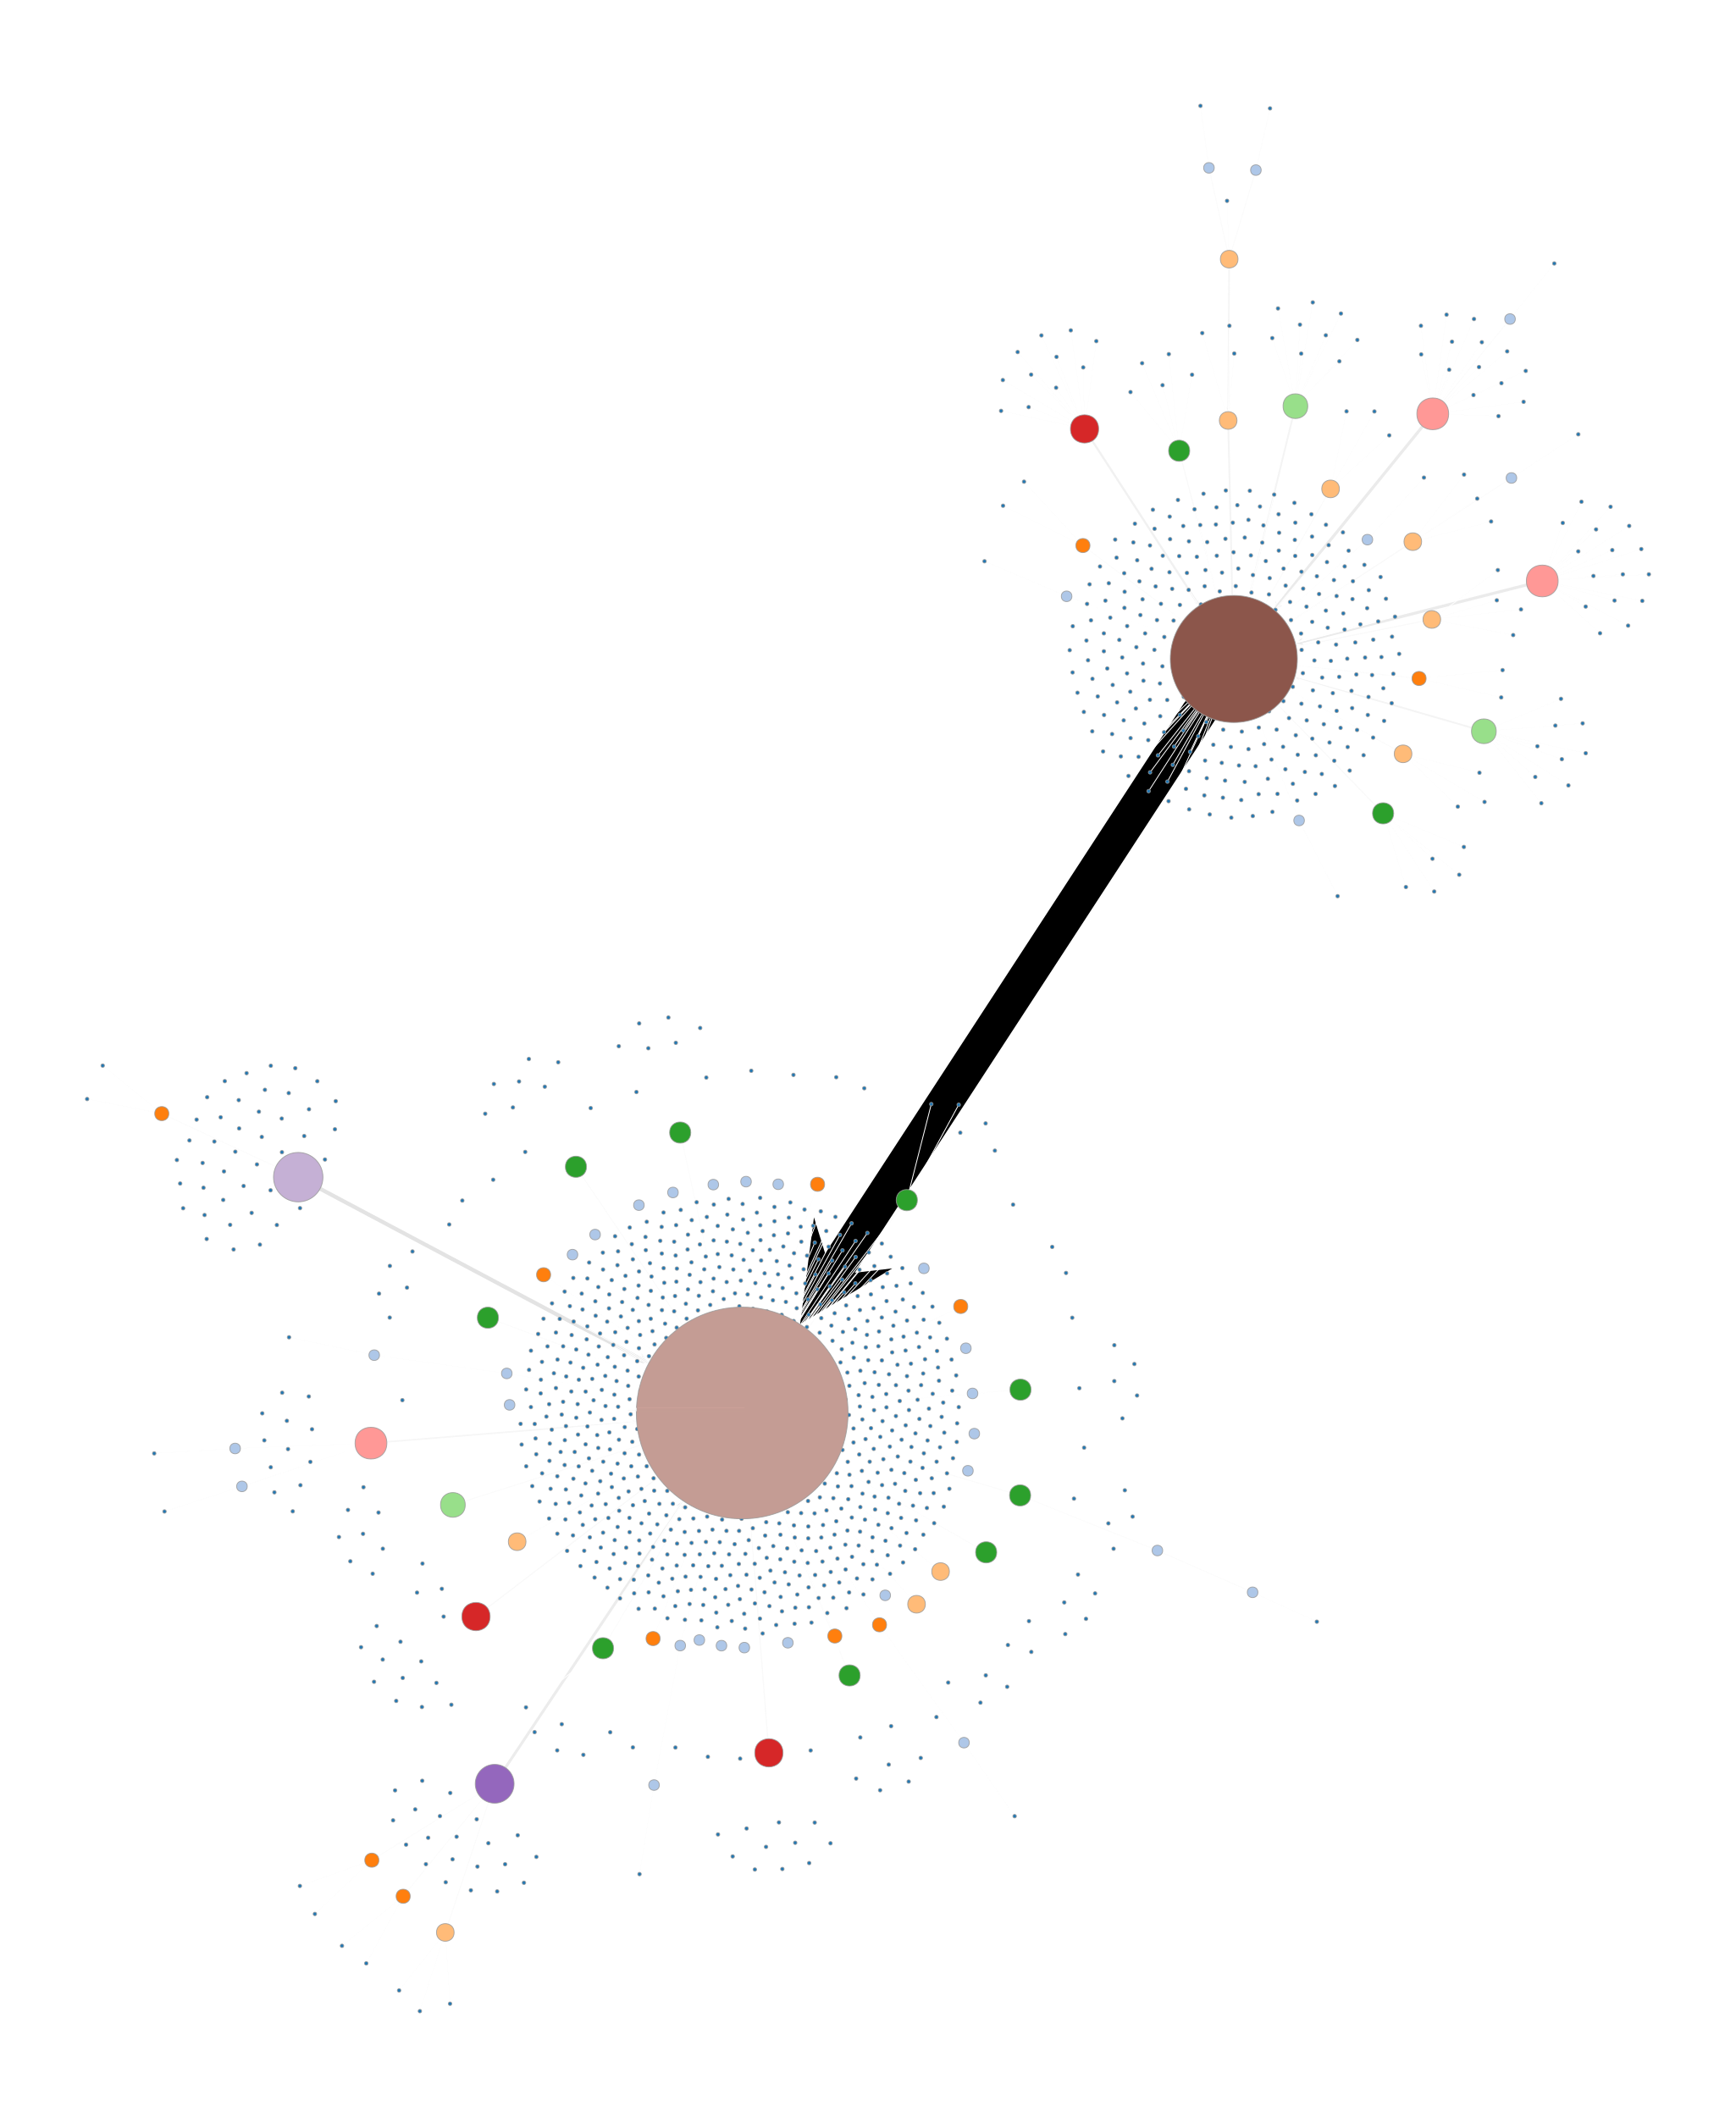
SFDP force-directed layout of a Price network with 1500 nodes. The vertex size and color indicate the degree, and the edge color and width the edge betweenness centrality.#