eigenvector#
- graph_tool.centrality.eigenvector(g, weight=None, vprop=None, epsilon=1e-06, max_iter=None)[source]#
Calculate the eigenvector centrality of each vertex in the graph, as well as the largest eigenvalue.
- Parameters:
- g
Graph Graph to be used.
- weight
EdgePropertyMap(optional, default:None) Edge property map with the edge weights.
- vprop
VertexPropertyMap, optional (default:None) Vertex property map where the values of eigenvector must be stored. If provided, it will be used uninitialized.
- epsilonfloat, optional (default:
1e-6) Convergence condition. The iteration will stop if the total delta of all vertices are below this value.
- max_iterint, optional (default:
None) If supplied, this will limit the total number of iterations.
- g
- Returns:
- eigenvaluefloat
The largest eigenvalue of the (weighted) adjacency matrix.
- eigenvector
VertexPropertyMap A vertex property map containing the eigenvector values.
See also
betweennessbetweenness centrality
pagerankPageRank centrality
hitsauthority and hub centralities
trust_transitivitypervasive trust transitivity
Notes
The eigenvector centrality \(\mathbf{x}\) is the eigenvector of the (weighted) adjacency matrix with the largest eigenvalue \(\lambda\), i.e. it is the solution of
\[\mathbf{A}\mathbf{x} = \lambda\mathbf{x},\]where \(\mathbf{A}\) is the (weighted) adjacency matrix and \(\lambda\) is the largest eigenvalue.
The algorithm uses the power method which has a topology-dependent complexity of \(O\left(N\times\frac{-\log\epsilon}{\log|\lambda_1/\lambda_2|}\right)\), where \(N\) is the number of vertices, \(\epsilon\) is the
epsilonparameter, and \(\lambda_1\) and \(\lambda_2\) are the largest and second largest eigenvalues of the (weighted) adjacency matrix, respectively.Parallel implementation.
If enabled during compilation, this algorithm will run in parallel using OpenMP. See the parallel algorithms section for information about how to control several aspects of parallelization.
References
[eigenvector-centrality]http://en.wikipedia.org/wiki/Centrality#Eigenvector_centrality
[power-method][langville-survey-2005]A. N. Langville, C. D. Meyer, “A Survey of Eigenvector Methods for Web Information Retrieval”, SIAM Review, vol. 47, no. 1, pp. 135-161, 2005, DOI: 10.1137/S0036144503424786 [sci-hub, @tor]
[adamic-polblogs]L. A. Adamic and N. Glance, “The political blogosphere and the 2004 US Election”, in Proceedings of the WWW-2005 Workshop on the Weblogging Ecosystem (2005). DOI: 10.1145/1134271.1134277 [sci-hub, @tor]
Examples
>>> g = gt.collection.data["polblogs"]
>>> g = gt.GraphView(g, vfilt=gt.label_largest_component(g))
>>> w = g.new_edge_property("double")
>>> w.a = np.random.random(len(w.a)) * 42
>>> ee, x = gt.eigenvector(g, w)
>>> gt.graph_draw(g, pos=g.vp["pos"], vertex_fill_color=x,
...               vertex_size=gt.prop_to_size(x, mi=5, ma=15),
...               vcmap=matplotlib.cm.gist_heat,
...               vorder=x, output="polblogs_eigenvector.pdf")
<...>
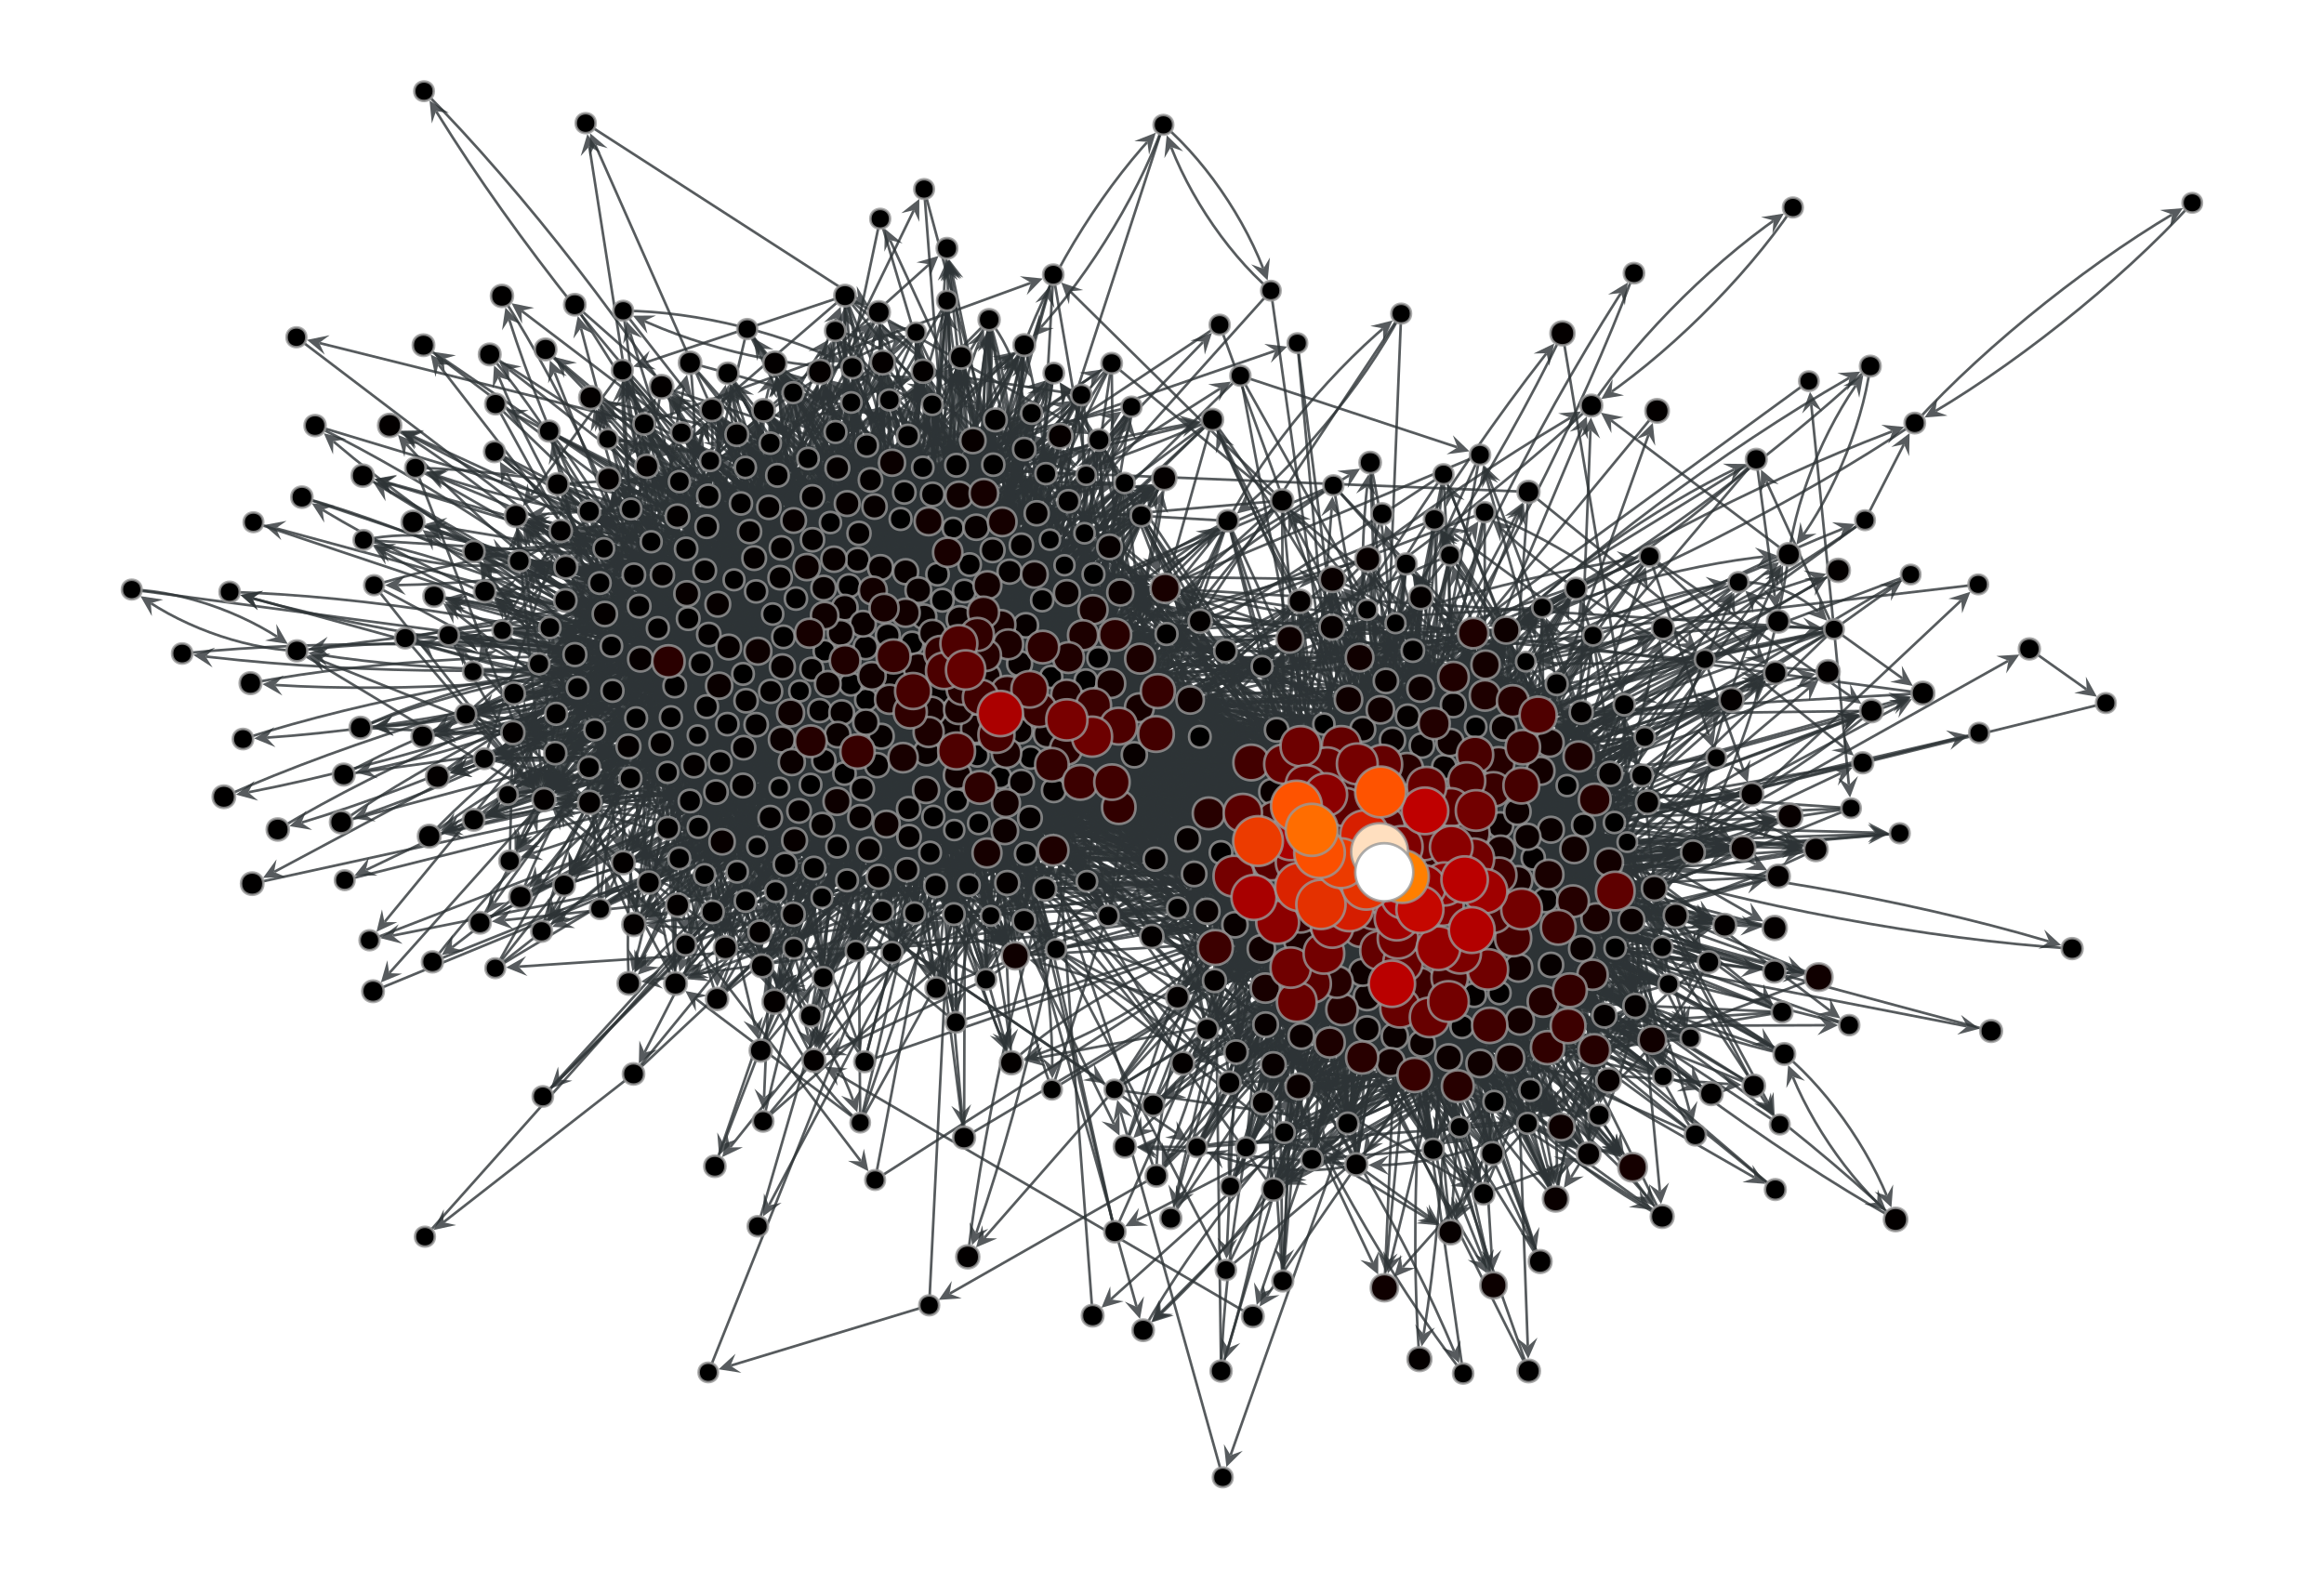
Eigenvector values of the a political blogs network of [adamic-polblogs], with random weights attributed to the edges.#